
A repeat of 'Black Monday'?
A repeat of 'Black Monday'?
Steve Hanke thinks the danger is palpable!

From Hanke in “Another Black Monday May Be Around the Corner”
The Federal Reserve’s policies are threatening U.S. financial markets and the economy. They are in danger of a steep recession and the risk of a repeat of 1987’s Black Monday.
And argues:
In 1987 growth of M2 declined by almost half, from 9.7% year-on-year in January to 4.9% in September, while M3—no longer published by the Fed—slowed from 8.7% to 3.6% over the same period. A bond-market crunch and monetary squeeze together led to a sudden, drastic reassessment of equity-market valuations. The same could happen today, particularly since the current jump in bond yields and monetary squeeze are much more pronounced than in 1987.
For years, analysts have tried to explain ‘Black Monday’ without success. No one, to my knowledge, has ever mentioned a “monetary squeeze” or “bond-market crunch” as causes. Most frequently we hear appeals to:
1. A strong bull market overdue for a correction
2. Program trading and the rise of computers
3. Portfolio insurance
3. Triple witching (The simultaneous expiration of stock options, stock index futures, and stock index options)
4. Mass panic
Ironically. although money supply growth was reduced, monetary policy was loose! The panel below shows this clearly, with the lesson being that you cannot look at only the money supply, having to take into account velocity (inverse of money demand).
(Note: TMP= “tight” monetary policy, a situation were the fall in velocity is greater than the increase in money supply or the rise in velocity is smaller than the fall in money supply. LMP= “loose” monetary policy, a situation where the rise in velocity is greater than the fall in money supply or the increase in money supply is greater than the fall in velocity).
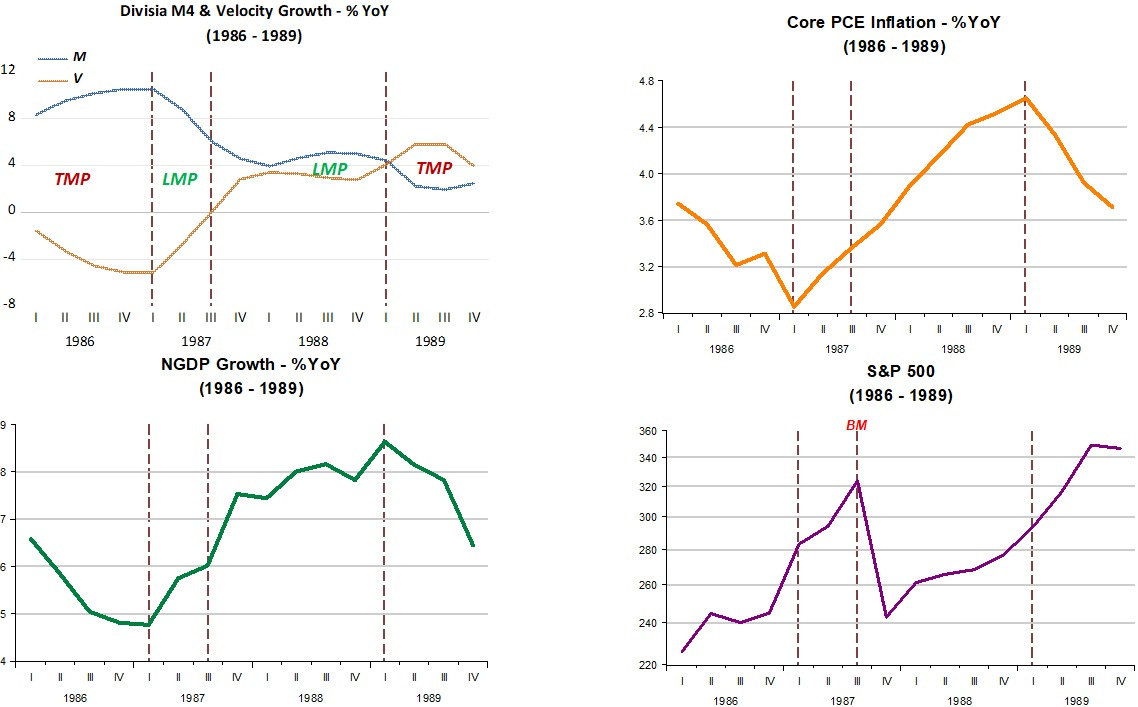
It appears Hanke was 100% wrong to say that there was a “monetary squeeze” in 1987! In fact, throughout 1987-88 monetary policy was “loose”!
When referring to the present, Hanke writes:
In all of this, an appreciation for time lags is critical. The Fed ignored the huge acceleration in the quantity of money and thus failed to anticipate the ensuing inflation.
The panel “discredits” some popular misconceptions.
One is that the stance of monetary policy does not refer to the behavior of interest rates, being accurately defined by the growth of aggregate nominal spending, or NGDP. When monetary policy is “tightening”, NGDP growth is falling. When monetary policy is loosening, NGDP growth is rising.
The other is that there are no lags in the effect of monetary policy. As soon as monetary policy “tightens”, inflation falls. And inflation rises as soon as monetary policy “loosens”.
When referring to the present, Hanke writes:
Early in the pandemic, the volume of U.S. dollars in circulation soared. For two years starting in March 2020, the M2 money supply—a measure of the cash and checkable deposits in circulation plus savings deposits and other easily convertible assets—grew at an unprecedented annualized rate of 16.5%. That is more than three times the appropriate rate for hitting the Fed’s 2% inflation target.
Then, in March 2022, the Fed changed course, first tightening the money supply by increasing the federal-funds rate and then introducing quantitative tightening. Between July 2022 and August 2023, the M2 supply contracted by 3.9%, the most extreme contraction since 1933.
The panel below describes for the period 2020 to 2023.II the same variables described during 1986 -1989.

When the pandemic began. monetary policy “tightened”. This was due to a surprise large drop in velocity. The Fed reacted quickly, expanding the broad money supply (Divisia M4), which quickly rose to 30% YoY.
It´s quite funny that Hanke says that “is more than three times the appropriate rate for hitting the Fed’s 2% inflation target.” I wonder how deep and long the recession would have been if the Fed had pursued the “appropriate” rate of money growth!
The recession was very short (2 months) and the recovery fast. But the Fed wanted more, not satisfied with conditions in the labor market (see here).
So, in early 2021, the Fed adopted an extremely (for the most part) expansionary monetary policy, but as 2021 ended monetary policy began to tighten. Note that this time around, the behavior of inflation reverses one quarter later. This was due to the strenght of the supply shock from the Russian invasion of Ukraine, sprinkled with effects from supply disruptions still present.
The rate of growth of the broad money supply has been negative for some time. To Hanke, this means that:
The Fed continues to ignore the money supply, and we now face the opposite problem. The money supply has been contracting for 18 months, and soon, after the overhanging extra money from 2020-21 has been used up, spending will plunge and inflation will fall, not simply to 2%, but below—and perhaps even into deflation in 2025.
But, from a correct monetary perspective, this is just what is needed to bring money supply growth in line with money demand growth, with the objective of reaching a sustainable stable rate of NGDP growth (someting of the order of 4.5% - 5% YoY).
Just as the events of 2020 required an “abnormal” rate of money growth, the situation at present requires an “abnormal” rate of monetary contraction.
Hanke´s very wrong and misleading analysis leads to an equally wrong conclusion, with him stating that:
When the stock market crashes, “higher for longer” will become a thing of the past as the Fed makes an abrupt pivot. Then the 10-year yields and U.S. dollar will come tumbling down.
Unlike 1987, today's monetary policy is still loose. Only when velocity falls, will there be a sharp decline.
Hanke was right in describing Black Monday as a squeeze. 1987 was the litmus test for Central Bank stupidity (no black swan). Even Robert Prechter’s Elliott Wave International got it exactly right.
Monetary flows (volume X’s velocity), fell from 16 in AUG, to 4 in NOV (See G.6 release – debit and demand deposit turnover). [ Δ, not Δ Δ ] Note, money flows, bank debits (money actually exchanging counter-parties), turned negative during the S&L crisis.
http://monetaryflows.blogspot.com/2010/07/monetary-flows-mvt-1921-1950.html
Conterminously (3 months prior to the crash), the rate-of-change in RRs (the proxy for R-gDp), was surgically sharp, decelerating faster than in any prior period since the series was first published in January 1918. The proxy declined from 11 in JUL to (-)4 in OCT. [ Δ, not Δ Δ ]
Accompanying this sharp deceleration in the RoC for M*Vt (proxy for all transactions in American Yale Professor Irving Fisher’s truistic: “equation of exchange”, the monetary authority mis-judged macro-economic strength (like the last half of 2008), and on Sept. 4 the FOMC raised (1) the discount rate, which was not yet a penalty rate, 1/2 percent to 6%, & (2) the policy FFR 1/2 percent to 7.25% (up from 5.875% in Jan).
Black Monday began when the target FFR was increased to 6.5% on 9/4/1987. The effective FFR began to trade above the policy rate c. 9/22/1987 (constrained by reserve demand). The effective FFR spiked on Thursday (the very first day of the reserve maintenance period).
On Sept. 30 the effective FFR spiked at 8.38%; fell to 7.30% by Oct. 7; then rose to back to 7.61% Oct 19 (Black Monday). Thus, the effective FFR spiked 36 basis points higher than the FOMC’s official target, it’s policy rate on “Black Monday”.
The shortfall in the quantity of legal reserves supplied by the FRB-NY’s trading desk (which had already dropped at a rate not exceeded at any time since the Great Depression) bottomed with the bi-weekly period ending 10/21/87. This was the trigger. However, the Fed covers: The Nattering Naybob’s “Elephant Tracks”. So, you can't run a regression against the historical time series.
At the same time, the 30-year conventional mortgage yielded 11.26%, up from 8.49% in Jan. 87, & Moody’s 30-year AAA corporate bonds yielded 11.06% on 10/19/87, up from 9.37% in Jan. 87.
The preceding tight monetary policy (monetary policy blunder), i.e., the sharp reduction in legal reserves (mirroring the absolute decline in our means-of-payment money), had effectively forced all rates up along the yield curve in the short-run (when inflation and R-gDp were already markedly subsiding). I.e., interest is the price of loan funds, the price of money is the reciprocal of the price level.
Note: interest rates may either rise or fall during the short-run, in response to the FOMC tightening policy, depending upon the “arrow of time”, and the monetary fulcrum (the thrust of inflation).
On 10/19/87 the CBs had to scramble for reserves (too stringently supplied relative to demand) at the end of their maintenance period (bank squaring day), to support their loans-deposits (it is noteworthy that contemporaneous reserve requirements were then in effect exacerbating the shortfall & response time).
A significant number of banks, with large reserve deficiencies, tried to settle their legal reserve maintenance contractual obligations at the last moment. But the FRB-NY’s “trading desk” failed to accommodate the liquidity needs in the money market – until it was already way too late (i.e., ignored their perversely coveted interest rate transmission mechanism).
I.e., it was a major monetary policy blunder by the Maestro, Chairman Alan Greenspan. And economists don’t talk about what the ABA doesn’t want them to. See - Sent: Thu 11/16/06 9:55 AM “Spencer, this in an interesting idea. Since no one in the Fed tracks reserves (because the ABA and stupid economists want to eliminate them)…” and “Today, with bank reserves largely driven by bank payments (debits), your views on bank debits and legal reserves sound right!” – Dr. Richard G. Anderson
Oh wait, wasn’t the crash blamed on programmed trading (reflecting academic censorship and fake news). Rewriting history, the Fed covers its “elephant tracks”. It’s not: Don’t fight the Fed. It’s: Don’t fight the ABA.