
The unusual recession & recovery
The unusual recession & recovery
followed by an even more unusual expansion & monetary control amidst shocks

The panel below sets the scene. It is divided into 6 “stages”. As I´ll argue, the top LHS chart, depicting broad money supply growth (Divisia M4) and velocity growth, defines the stance of monetary policy, which is reflected in the behavior of NGDP growth in the bottom LHS chart. The RHS charts are determined by those two charts with added “ingredients sprinkled” from supply shocks.

In stage 1, prior to the onset of C-19, monetary policy was quite “decent”, with money growth closely offsetting changes in velocity thus keeping NGDP growing at a stable rate (close to a stable level growth path (see Endnotes)). Under this stabilizing monetary policy, inflation was stable and so was real output (RGDP) growth.
In stage 2, we observe that C-19 was a surprise. It immediately and strongly impacted velocity, which fell abruptly (money demand growth “exploded”). The excess demand for money drove down aggregate nominal spending (NGDP) growth, inflation and real growth.
Monetary policy, however, was quick to react, with money supply growth rising strongly to reduce te excess demand for money. NGDP growth stopped falling and began to rise. The same happened to inflation and real growth.
As shown in the Endnotes, by the end of stage 2 in early 2021, the recovery was complete, with NGDP back to the post Great Recession trend path.
At that point, the Fed turned its attention to the labor market. In February, Powell made a speech Getting back to a strong labor market. At the next FOMC Meeting, in March, we read:
The Committee decided to keep the target range for the federal funds rate at 0 to 1/4 percent and expects it will be appropriate to maintain this target range until labor market conditions have reached levels consistent with the Committee's assessments of maximum employment and inflation has risen to 2 percent and is on track to moderately exceed 2 percent for some time.
The signal that monetary policy was going to be expansionary could not be more clear. That´s exactly what happens in stage 3. While velocity rises significantly, money supply growt falls by much less. NGDP growth, inflation and real output growth take off.
In the second half of stage 3, monetary policy becomes less expansionary. Velocity stops rising but money supply growth stops falling, so there´s still an excess money growth. Notice that while NGDP growth recoils somewhat, RGDP growth falls by more, while inflation keeps on rising. At that point, supply constarints or impediments from C-19 become binding. These supply constraints have the same effect as a negative supply shock, identified by the fact that real output growth falls and inflation rises.
The fact that monetary policy became less expansionary at the same time enhances the drop in real output and weakens the rise in inflation.
Stage 4 depicts what is mostly a supply shock from the preparation for and subsequent invasion of Ukraine. RGDP growth falls and inflation rises. In the scond leg of stage 4, monetary policy tightens somewhat. While velocity growth remains stable, money supply growth drops to near zero. That´s why you observe that while headline inflation rises, core inflation shrinks a little.
Stage 5 provides the textbook example of a negative demand shock. The (mildly) restrictive monetary policy results in falling inflation (both headline and core) and falling RGDP growth.
In stage 6, while monetary policy remains restrictive, with NGDP growth falling further, the fall in oil prices and the fading C-19 supply constraints lead to a positive supply shock, with real output growth rising and inflation falling. While the rise in real output growth is “constrained” by the restrictive monetary policy, the fall in inflation is enhanced!
After the end of our sample in August, new shocks have manifested, with the Hamas-Israeli conflict being the notable event. Certainly the waters the Fed will have to navigate just became trickier!
Endnote
The chart below shows the evolution of the Level of NGDP, with the same 6 stages indicated.
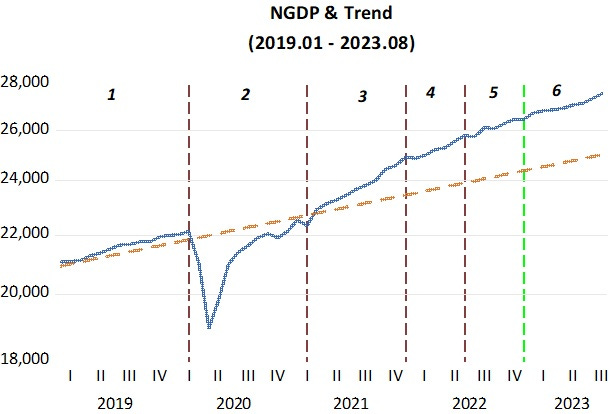
Note how fast the recovery was. By the end of stage 2, NGDP was back to the post GR trend path. Stage 3 clearly shows that monetary policy was highly expansionary. The slope of the NGDP line (and so its growth rate) begins to fall in stage 4 and continues to fall over the subsequent stages.
The endpoint for the Fed is to flatten the NGDP line so that it becomes parallel to the dotted brown line that defines the post GR trend growth path. If that happens, the economy will be stabilized and things like inflation and longer term yields will “fall back in line”!
Excellent commentary