
The shapes of cycles
The shapes of cycles
Usually, it´s a version of the "Longhorn", but there are exceptions

My view is that economic cycles, or fluctuations, are determined by monetary policy. The problem, however, is that there seems to be no agreement on how to define the stance of monetary policy. Without that, we cannot convincingly relate economic cycles, or fluctuations, to monetary policy.
The monetary policy stance “controversy” is illustrated by statements from Fed officials over time:
Frederick Mishkin in August 2008:
…The first is the real danger of focusing too much on the federal funds rate as reflecting the stance of monetary policy. This is very dangerous. I want to talk about that…
Atlanta Fed Dennis Lockhart in February 2014:
In our public remarks over much of last year, my colleagues and I stressed a couple of very important messages. First, even with the phase-out of asset purchases, the basic stance of policy remains highly accommodative. To translate, the Committee intends to keep interest rates very low.
Minneapolis Fed Neel Kashkari In September 2023:
Financial markets have responded to the FOMC’s moves, with the 10-year real rate continuing to climb, indicating that the overall stance of monetary policy has likely tightened further. But as I explained in my prior essays, ultimately the overall stance of monetary policy is determined by the position of long real rates relative to the neutral real rate, which is uncertain.
This long-standing “controversy” may have led Scott Sumner to write, two weeks ago that:
Macroeconomics will never become a mature field until we get serious about defining the stance of monetary policy. Step one is to abandon interest rates as an indicator of policy and move on to more promising alternatives—especially market forecasts of future NGDP.
I´ll simplify Scott Sumners postion by looking at what´s happening to actual NGDP growth to define the stance of monetary policy.
From the equation of exchange in growth form: m+v=p+y, where p+y is equal to the growth of aggregate nominal spending, or NGDP growth, NGDP growth will be stable (along a level gowth path) if the Fed varies the money supply (under its close control), to adequately offset changes in velocity (the inverse of money demand).
If the Fed, for any reason errs (thinking, for example, that inflation will rise) and excessively contracts the supply of money, NGDP growth will fall. If it errs in the other direction (thinking, for example, that unemployment will rise) and excessively expands the supply of money, NGDP growth will rise.
In that case, monetary policy will be “tightening” (or contractionary) if NGDP growth is falling and “loosening” (easing or expansionary) if NGDP growth is rising.
On purpose, I make no reference to interest rates. In fact, when the stance of monetary policy (under the NGDP growth definition) is expansionary, interest rates may be rising, and they may be falling when the NGDP growth-defined stance of monetary policy is tightening. (I believe it is by using interest rates as defining the stance of monetary policy that we get into the discussions on “lags in effect of monetary policy”. See here).
The shape of cycles and the stance of Monetary Policy
In their recent paper “Does Monetary Policy Matter? The Narrative approach after 35 years”, David and Christina Romer summarize:
Our contractionary shocks are decisions to tighten monetary policy because the current level of inflation was felt to be unacceptable. Our expansionary shock is a decision to loosen monetary policy because the current stable rate of unemployment was felt to be unacceptable, realizing that such a policy risked raising inflation.
In their sample period, covering 1947 to 2016, they find only one instance (1971) where the stance of monetary policy was expansionary. That turns out to be a nice “control” for my “NGDP growth-identification” of the stance of monetary policy.
Some examples:
1959 - 1962. There was a recession in 1960-61. Monetary policy tightened around this period, as the chart illustrates.

Inflation was brought down.
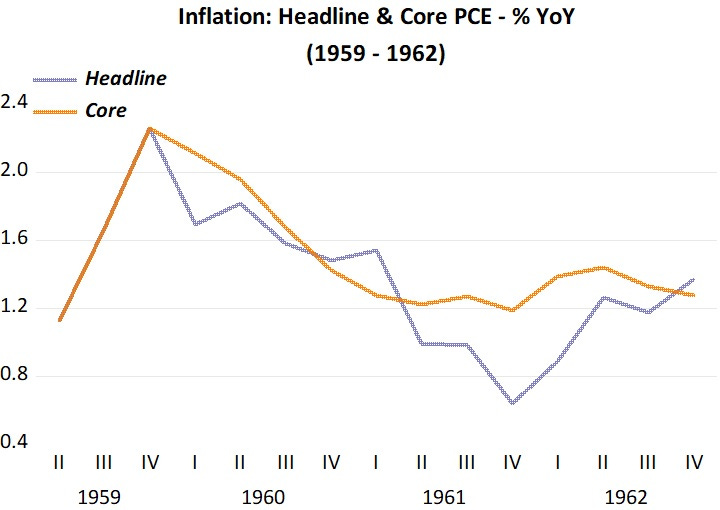
It appears that inflation a bit over 2% at the time was deemed “too high”!
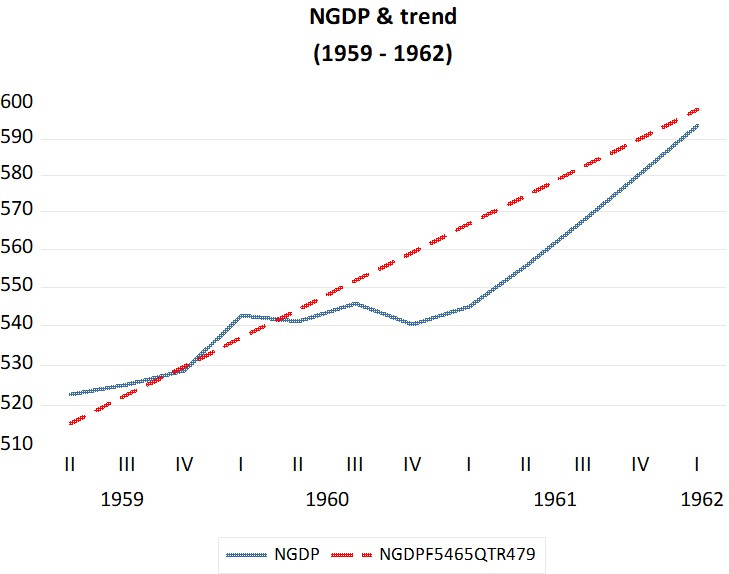
The next chart shows that monetary policy tightening brought NGDP below its trend path, but the subsequent easing of monetary policy took NGDP back to the trend path.
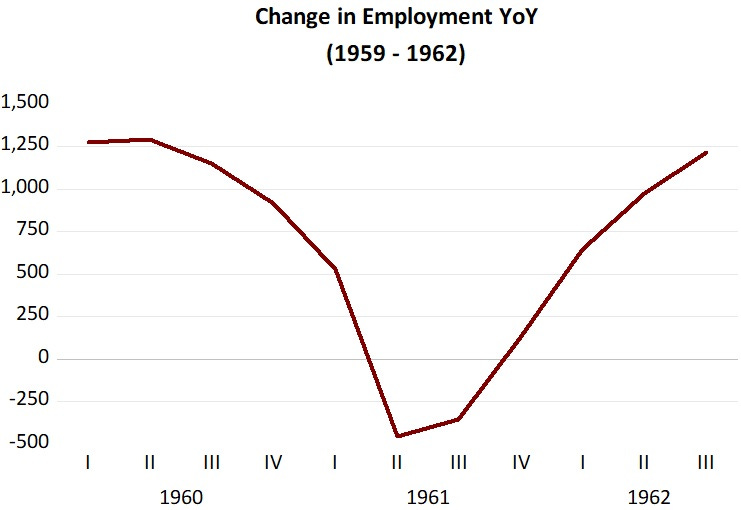
Interesting to see that the tightening and subsequent easing of monetary policy leads to the same “shape” in real variables such as employment. The mechanism at play here is as follows. With the fall in NGDP growth, given sticky wages, the wage/NGDP ratio drops leading to hiher unemployment (lower employment). When NGDP growth picks up, the wage/NGDP ratio falls so that employment rises again.
1999 - 2005. There was a recession in 2001. Monetary policy tightened around this period as the chart illustrates.
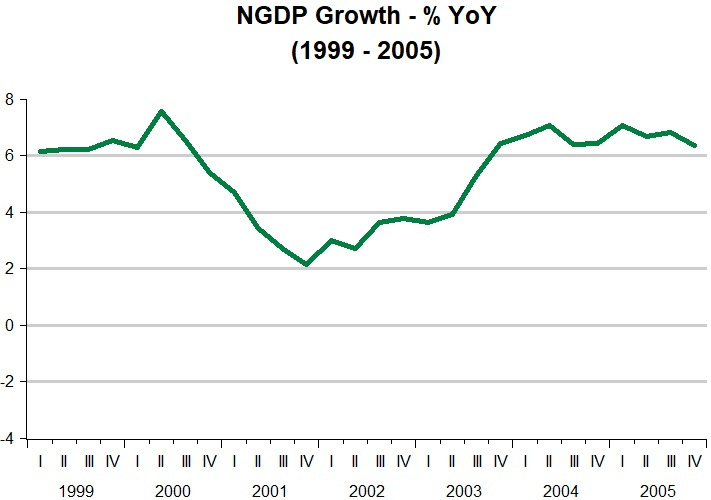
Note that this “longhorn” has a shorter nose than the 1959 -62 “longhorn”.
There was a lot of uncertainty at the time. In the aftermath of the Asia and Russia crises of 1998, oil prices were on the go. This may have spooked the Fed into tightening.
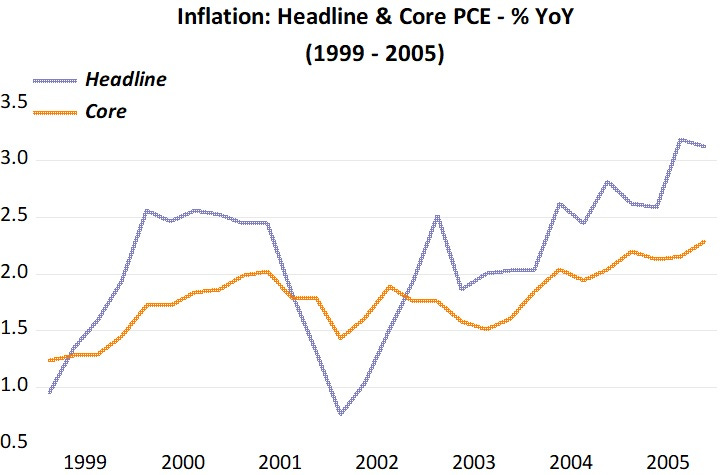
The chart shows that while headline inflation was “under pressure” due to oil price increases, core inflation remained contained.
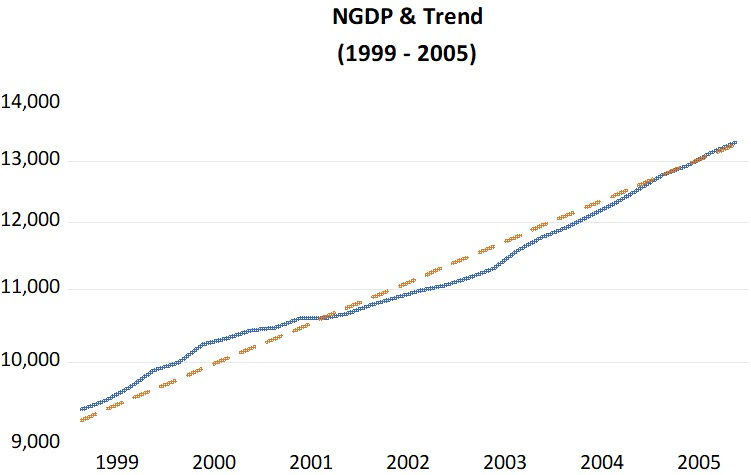
The next chart shows that, initially, monetary policy had eased somewhat, likely due to uncertainties from the Asia and Russia crises (note the spike in NGDP growth in the NGDP growth chart above). The fact was that NGDP was a bit above the trend path. The tightening that followed was excessive, bringing it a bit below trend, but subsequently the Greenspan Fed got its act together Fed and managed to take NGDP back to the trend path.
Again, real variables such as employment, pick up the same “longhorn shape” (including the “spike”) of the cycle induced by the tightening and subsequent easing of monetary policy!

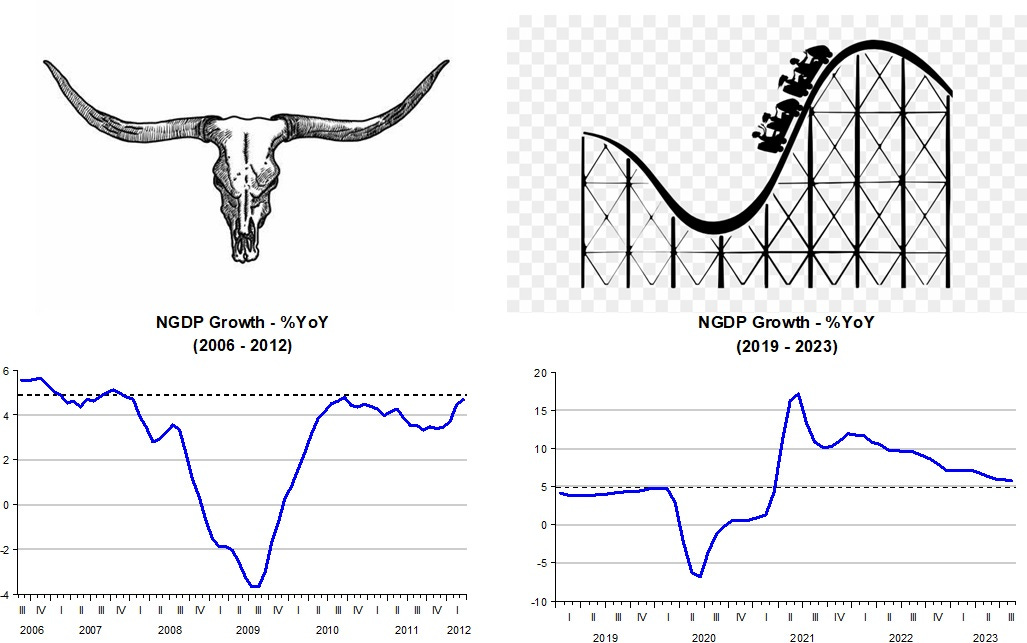
2007 - 2011 There was a recession from Dec 07 to June 09. It was dubbed the Great Recession”. The chart shows that monetary policy was not just tightened but “sqeezed”.
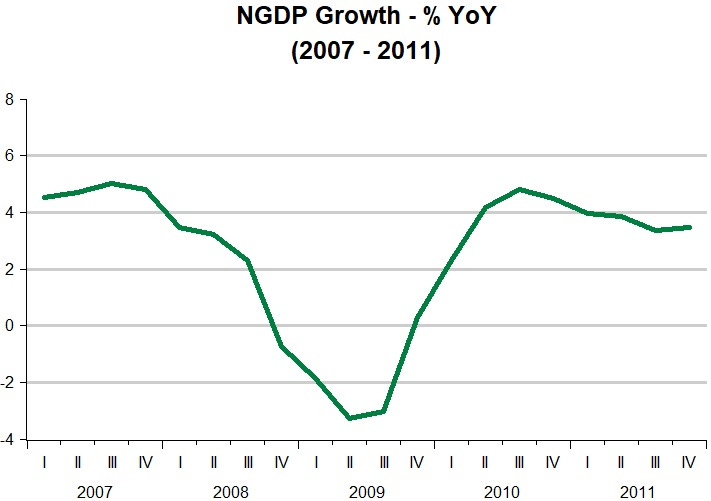
Note how long & deep is the nose of this “longhorn”!
From the FOMC Transcripts, there is no doubt the tightening was due to inflation fears, with the Fed not looking through jumps in oil prices.

What´s new and surprising, given the history of post WW2 cycles, is (1) how massive the tightening was and, (2) how the Fed did nothing to make up for the loss after the bleeding stopped! (compare the chart with the corresponding ones in the previous examples).
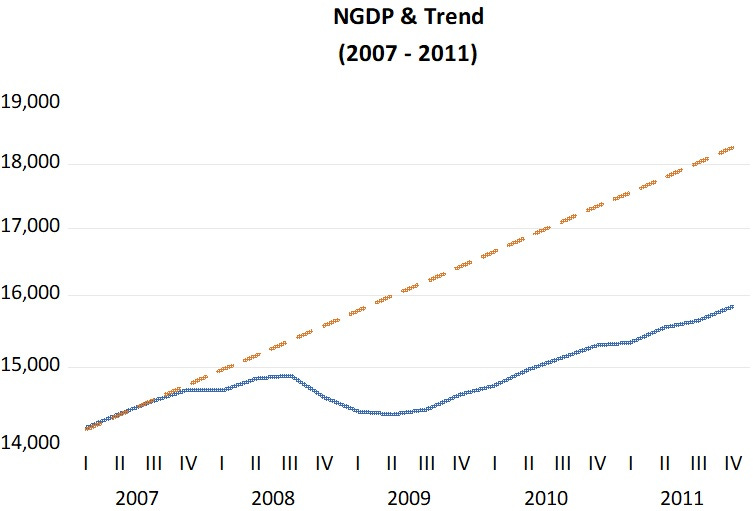
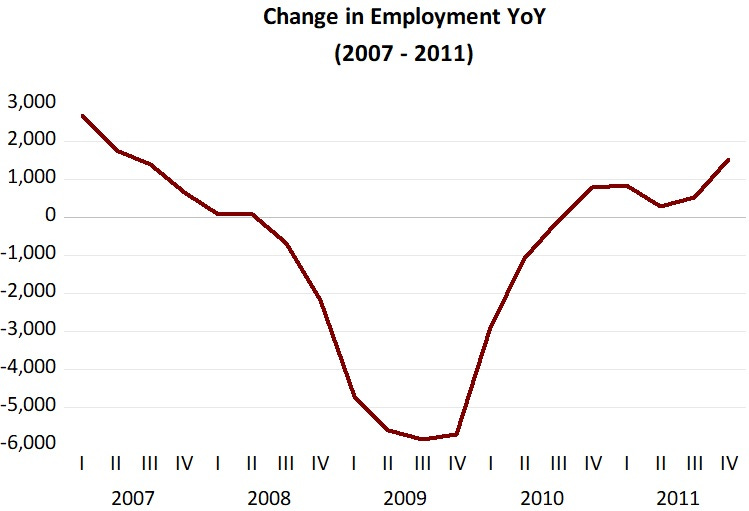
And the chart for employment changes shows very clearly the degree of pain that monetary policy mistakes can cause!
2019 - 2023 C-19 hit in early 2020 leading to an immediate and deep recession. Why was the recession so brief (just 2 months)? My cynic view is that since the recession was not caused by Fed actions, the Fed felt free to correct it without being critized for previous wrong actions! (Note: in this section I use monthly data).
To make the exposition easier to understand, I devide the period into 3 phases.
In phase 1 that extends from the end of 2019 to March 2021, we get our now familiar “longhorn shape”. While the “nose” is deep and long, the “longhorn´s face” is very “narrow”, meaning the recovery was very fast, as illustrated by the NGDP Level chart. I include the pre Great Recession (GR) trend to vividly illustrate how “permanently depressing” monetary policy was during the GR!
During this phase, inflation falls and comes back to trend. Headline falls and rises by more reflecting the the behavior of oil prices.

The second phase extends from April 2021 to December 2021. I call this the “monetary expansion phase”. This accords well with Romer & Romer´s definition, in which:
Our expansionary shock is a decision to loosen monetary policy because the current stable rate of unemployment was felt to be unacceptable, realizing that such a policy risked raising inflation.
In February 2021, Powell made an important speech: “Getting back to a strong labor market”. That speech perfectly reflected the “Fed´s decision to loosen monetary policy because the current rate of unemployment was felt to be unacceptable”.
The unemployment rate at the time was 6.3%. The monetary expansion came and this is what transpired.

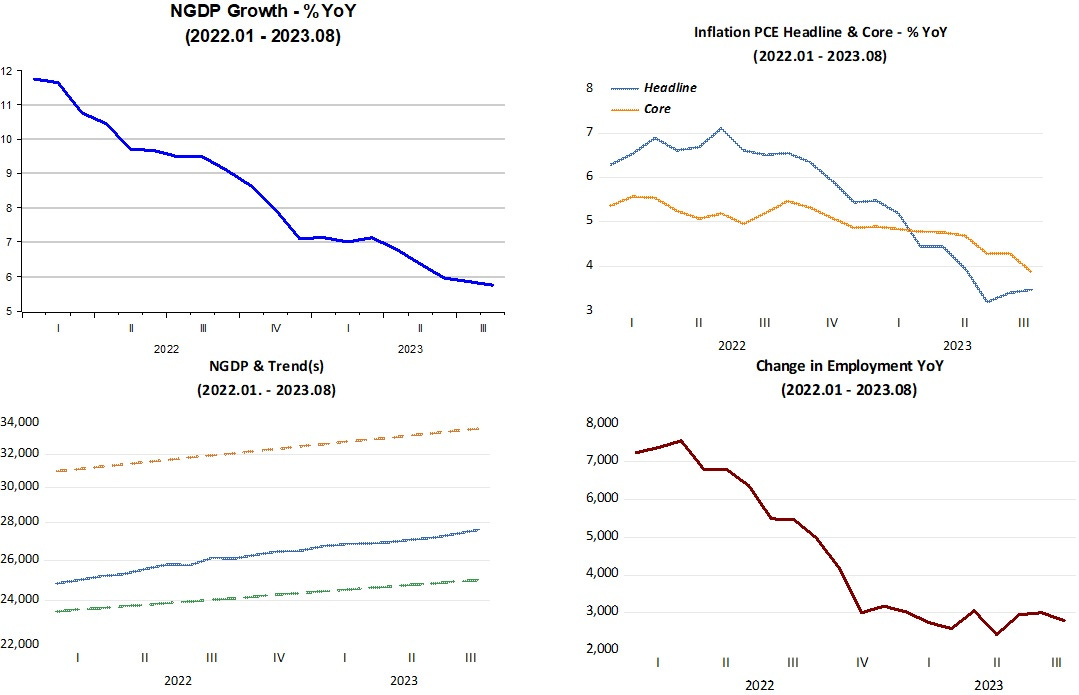
NGDP growth surged and remained strong even after recoiling. The NGDP level climbed significantly above the post GR trend (but still remained a long distance from the pre GR trend to which it would have remained close if monetary policy had not been so botched in 2008-09). Both headline and core inflation climbed far above target. Employment surged and also remained strong even after recoiling.
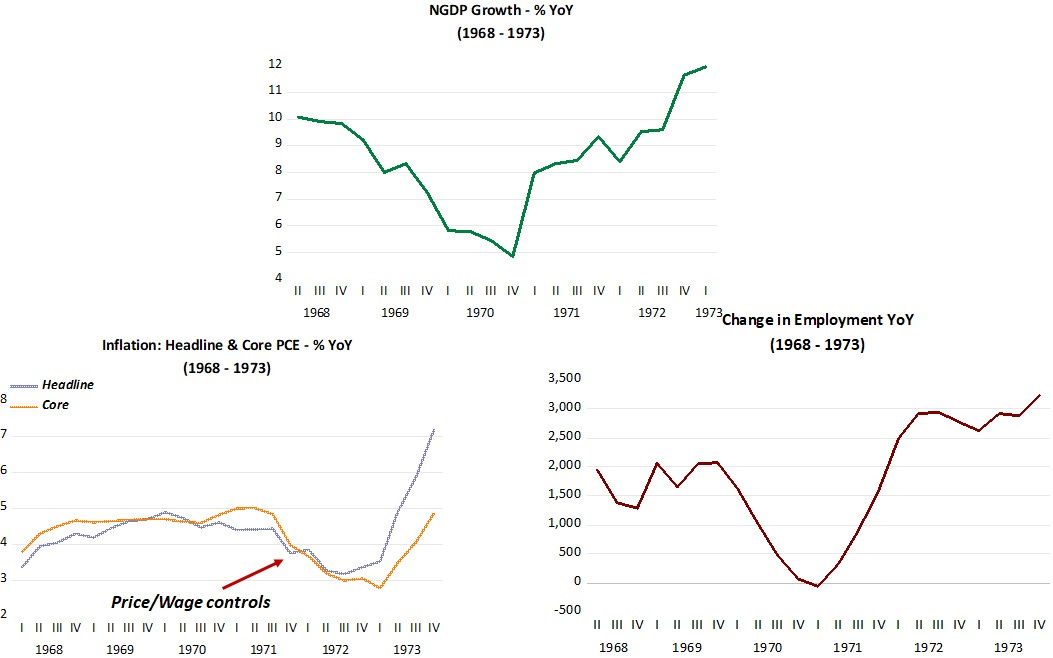
In their study, Romer & Romer had identified only one instance of expansionary monetary policy, and that was in 1971, following the 1969-70 recession. Their sample ends in 2016.
Early in 1971, unemployment stood at 6.1%, having climbed from 3.5% during the recession of 1970. so the “decision was made to ease monetary policy”, the first such decision in post WW2 history. To try to minimize the inflationary effects of the decision, price and wage controls were implemented, lasting for some time.
The pattern that transpires is the same one observed in the 2021 expansion, with the difference that the 1971 expansion continued anabated after 1973, solidifying what was later named the “Great Inflation”!
This time around, the monetary expansion began to be reversed at the start of 2022. NGDP growth fell consistently and significantly. The level of NGDP flattened, and is converging to a trend growth rate similarly to the one that prevailed on average since the early 1990s (4%-5%). Inflation turned down (even more so if some “distorting” elements are excluded) and employment gains stabilized at a robust level.
Conclusions
The stage is set. What will the story continue? Will there be a recession? That´s possible. Fed mistakes could be compounded by “external” factors, such as the recent conflict in the middele east and its impact on things such as the price of oil.
Will there be a soft landing? Also possible, even if there are negative “external” factors present. For that, the Fed has to calibrate monetary policy to lead and then keep NGDP growth on a stable (~4.5%) growth path, avoiding “crashing” the economy into the level path that prevailed before C-19 hit.
As always, when it comes to business cycle, the Fed is King!
How easy is it in real time to know what the stance of your policy really is?
Once again we are left hanging by lack of confidence that they Fed will "do the right thing". Is this lack a bug in the system or a feature? Is it inevitable given, as you say, the range of challenging potential storms that could blow the Fed off course?