
Post C-19 Inflation: The story of a "bribe"
Post C-19 Inflation: The story of a "bribe"
to "facilitate" a fall in unemployment & improve the labor market

Recently, David Andolfatto published a post with the title “Constrained Efficient Inflation”. The word “efficient” bugged me for a while. If inflation was “efficient” it must mean that it was “used” to get some “benefit”. For that, inflation had to be “constrained”, because if “generalized” or “perpetuated”, no ”benefit” would be forthcoming.
So, I tought, why not call inflation a “bribe”? After all, a “bribe”, as inflation, involves money. It also has to be “temporary”. If it is “perpetuated” it becomes “blackmail”, something very different. For example, if you “bribe” a witness to commit perjury, and because of his testimony the defendant is found “not guilty”, your “bribe “ was “efficient” (and constrained to that occasion).
My Figure 1 is a simplified version Andolfatto´s Figure 1 (unclogged by showing just one measure of inflation - the headline CPI).
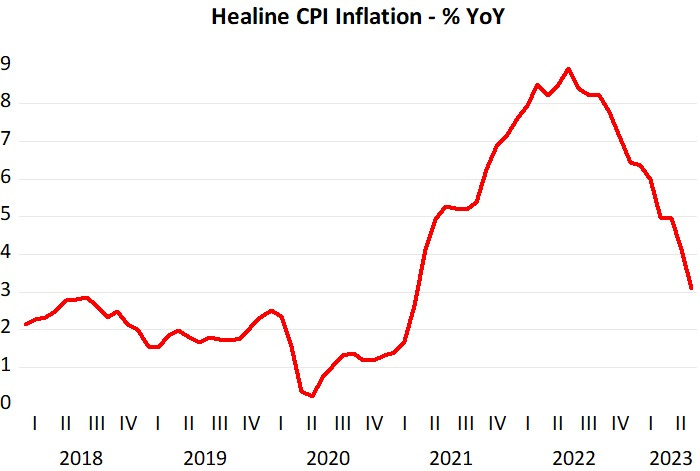
Figure 1
After presenting his picture, Andolfatto asks:
How should we interpret the hump-shaped inflation dynamic in Figure 1? The answer to this question is critically important because an evaluation of monetary and fiscal policy over this episode requires a proper interpretation of the phenomenon being studied.
More than one interpretation is possible, of course. But any useful interpretation will have to rely on theory at some level. The goal of this paper is to develop a dynamic general equilibrium model that can explain the qualitative properties of data in an empirically plausible manner and be used to assess the monetary and fiscal policies employed since March 2020.
And he tries to do just that as you can read in his post.
What I´ll do is give a, hopefully convicing, interpretation of the humped-shaped inflation dynamics observed in Figure 1. That´s the exact same objective as Andolfatto´s. I just hope mine is simpler and more convincing than his.
As usual, I´ll develop the story in a “picturesque” way. The model behind the conjectures is the dynamic version of the equation of exchange, according to which the sum of the growth of money supply (m) and the growth in velocity (v) equals the sum of the growth of prices (p) and the growth of real income (y) - m+v=p+y.
The equation of exchange identity is interpretd from a “thermostat perspective”, where m is the thermostat, v the outside temperature, and p+y (or NGDP) the inside temperature. If you´ve never read a post of mine, you can read about it here, or in greater detail (with the inclusion of a quiz) here (courtesy of Anthony J Evans).
The first picture shows the behavior of NGDP (remember that NGDP=p+y). That behavior is the outcome of the interactions of m and v.

Figure 2
Andolfatto spends much of his post analysing the “pre-bribe” period, from March 2020 to March 2021.
What the picture above tells us is C-19 was a powerful demand shock due the abrupt and acute drop in v (or a very large increase in money demand). The Fed reacted promptly (if not immediately) to correct the money supply/money demand imbalance, so that in just a couple of months NGDP began to rise again towards the trend level path that had prevailed since the end of the Great Recession in mid-2009, reaching it just one year later, in March 2021.
The next picture, Figure 2, tells what happened to real output as a consequence of what happened to aggregate nominal spending (NGDP) in Figure 1.
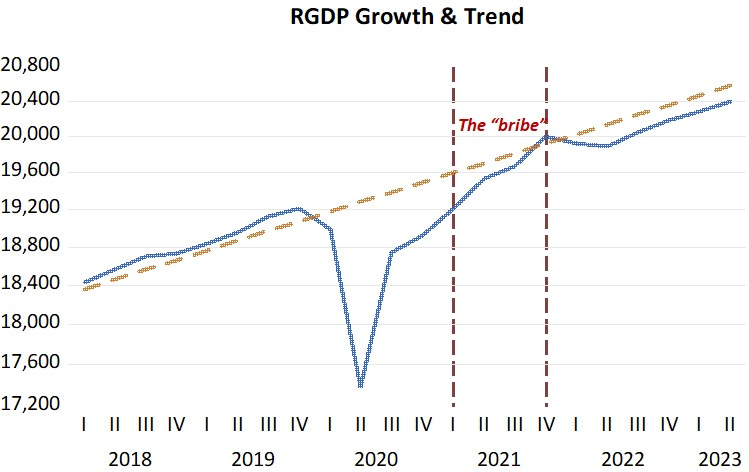
Figure 3
It is important to note that when NGDP reaches the trend path, real output (RGDP) is stuck at a lower level. I believe that difference reflects the “supply barriers” (or “supply impediments”) that took place due to C-19. Imagine “lockdowns”, “supply chain disruptions” and even the fast changes in “demand composition”.
If there had been no “bribe”, understood as the increase and acceleration of NGDP above trend (or an excess supply of money), NGDP would have evolved close to the trend path. With that, RGDP would have remained below its trend path, at least until the “supply barriers” had been resolved. In a sense, what the “bribe” paid for was the increase in “planes, trucks, boats and people” to get RGDP back to the trend path!
I think that´s too “defused” a reason for the “bribe”. “Bribes” have a more specific objective (like in the witness perjure example). What was that reason?
Who has the power to “bribe” the economy? Surely, the Central Bank. For what reason? Likely to affect and improve the most important social market in the economy, the labor market.
So it was not at all surprising to find that Jerome Powell “announced” his intention to “bribe” the economy in a February 2021 speech at the Economic Club of New York. The title of his speech was “Getting Back to a Strong Labor Market”. The idea of a “bribe” is made explicit towards the end:
The revised statement emphasizes that maximum employment is a broad and inclusive goal. This change reflects our appreciation for the benefits of a strong labor market, particularly for many in low- and moderate-income communities.
Recognizing the economy's ability to sustain a robust job market without causing an unwanted increase in inflation, the statement says that our policy decisions will be informed by our "assessments of the shortfalls of employment from its maximum level" rather than by "deviations from its maximum level."12 This means that we will not tighten monetary policy solely in response to a strong labor market.
Finally, to counter the adverse economic dynamics that could ensue from declines in inflation expectations in an environment where our main policy tool is more frequently constrained, we now explicitly seek to achieve inflation that averages 2 percent over time.
And Figure 4 shows the “payoff”. When Powell spoke, the rate of unemployment was 6.3% and thre was a risk that it would stay at those elevated levels if “something” wasn´t done!
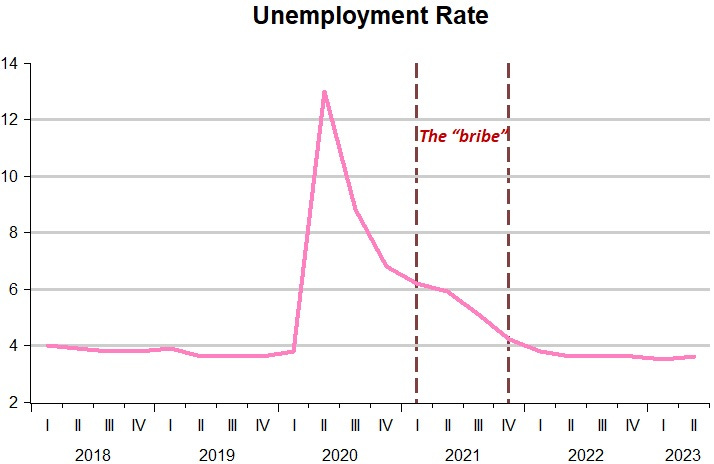
Figure 4
Other metrics of the labor market, like the 25-54 Labor Force Participation Rate and the level of employment improved considerably after that point.
In Figure 1 above, we note that after the second vertical dotted line, the “bribe” was significantly reduced. That is clear from the significant reduction in the slope of the NGDP line (which represents its growth rate). Why? Likely because at that point the labor market had improved considerably and the cost in terms of inflation was becoming “too high”.

Figure 5
Despite the drop in aggregate nominal spending (NGDP) growth after that point, inflation continued to increase for a while. Interestingly, that short period of time illustrates the only time a “classic” supply shock (to distinguish from “supply barriers” or “impediments”) was observed in the post C-19 period!
And that was due to the Russia invasion of Ukraine. In a “classic” supply shock we observe an increase in inflation and a drop in real output. This is clearly illustrated in Figure 2, where real output drops. (remember the cries of recession that became “prominent” at the time, and continue to be heard less “loudly” to the present).
But theory prevailed! The continued reduction in the growth rate of NGDP (reduction in the money supply/money demand imbalances) has brought inflation down. And as Figure 6 shows, NGDP growth is a “whisker away” from 4-5% “sustainable” growth rate.

If the Fed manages to get NGDP growth down to the 4-5% rate, and stay there, it will have succesfully achieved the desirable “soft landing”. If that happens, the “bribe” will have been “efficient”, especially because it will take the level of NGDP to a higher level (above the previouly “suboptimal” one that resulted from the monetary mistakes of 2008-09).
Of course the "bribe" had to be funded. That was the "inflation tax."