
Monetary Policy in the Great Depression
Monetary Policy in the Great Depression
Another instance showing the workings of Friedman´s Thermostat

George Selgin is writing a series on “The New Deal and Recovery”. In the Intro (where you find links to the ‘chapters’ written so far), he summarizes:
I believe that the New Deal failed to bring recovery because, although some New Deal undertakings did serve to revive aggregate spending, others had the opposite effect, and still others prevented the growth in spending that did take place from doing all it might have to revive employment.
I want to show in this post the monetary policies that resulted from all the “actions” or policy decisions taken during the 1929-1941 period. The details of those decisions are the subject of Selgin´s series. As he points out:
I´m not opposed to countercyclical economic policies, provided they serve to keep aggregate spending stable, or to revive it when it collapses.
In short, that statement is all about the workings of the thermostat. To recap, Friedman´s thermostat analogy as an explanation for the Great Moderation says:
In essence, the newfound stability was the result of the Fed (and many other Central Banks) stabilizing nominal expenditures. In that case, from the Equation of Exchange, according to which MV=PY, the Fed managed to offset changes in V with changes in M, keeping nominal expenditures, PY, reasonably stable.
The two charts below summarize the behavior of aggregate nominal spending (NGDP) and the associated real aggregate output that resulted during the four “stages” of the Great Depression
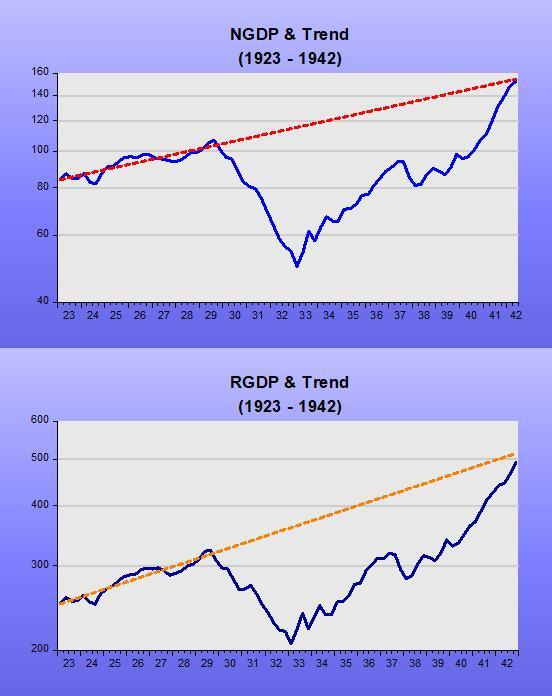
If anything, 1929 shows what happens when the thermostat breaks down. When velocity drops (money demand rises) deep and fast, if instead of offsetting that move in velocity money supply tanks, aggregate nominal spending collapses, and so does real output.
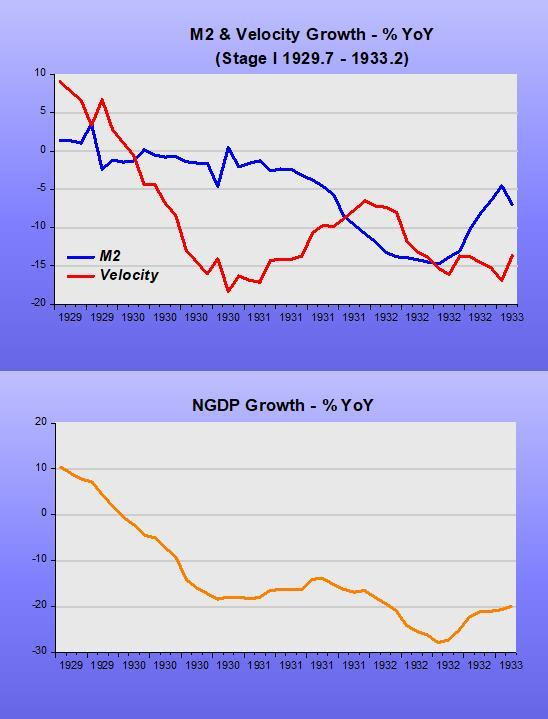
The next chart reveals what happened during 1929 and early 1933, the first “stage” of the GD.
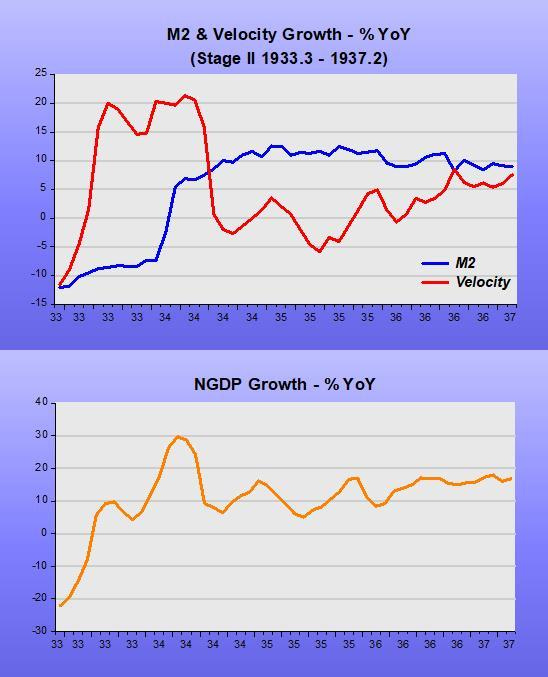
In the next Chart, we observe the power of monetary policy. With the thermostat set to “heat-up” the economy (with money supply growth reinforcing the rise in velocity, the opposite of what happened in 1929-33). Going off gold in March 1933 played a major role.
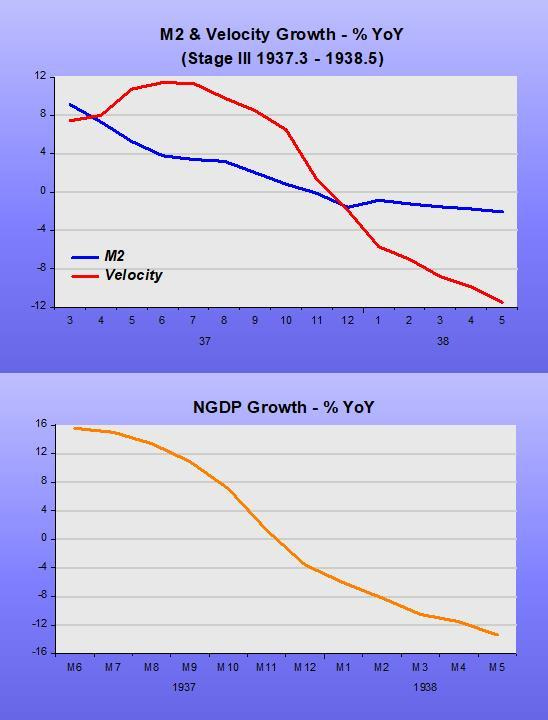
Going into Stage III we see a “reversal of fortune”, with monetary policy quickly tightening (culprits here are the gold sterilization policy by the Treasury & increase in required reserves by the Fed). In “The New Deal and Recovery Part IV – The FDR Fed, George Selgin writes:
…instead of taking steps to ramp-up the money stock, Fed officials became increasingly worried about…inflation! Noticing that banks had been storing-up excess reserves, they feared that a revival of bank lending might lead to excessive money growth, and therefore refrained from contributing directly to that growth. Then, finding a merely passive stance inadequate, they joined forces with the Treasury to offset gold inflows. These steps were among several that contributed to the “Roosevelt Recession” of 1937-8…
Stage IV coincides with the end of gold sterilization and ensuing expansionary monetary policy. The military spending that began in 1940 to bolster the defense effort gave the nation’s economy an additional boost. This worked through the rise in velocity while money growth remained stable.
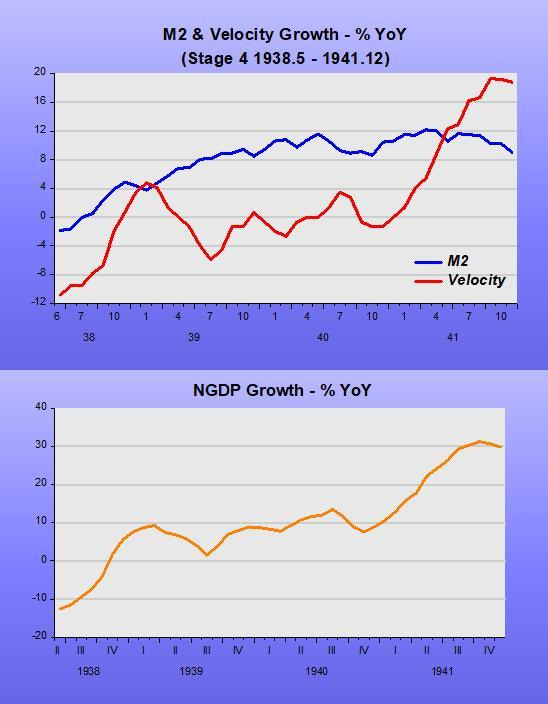
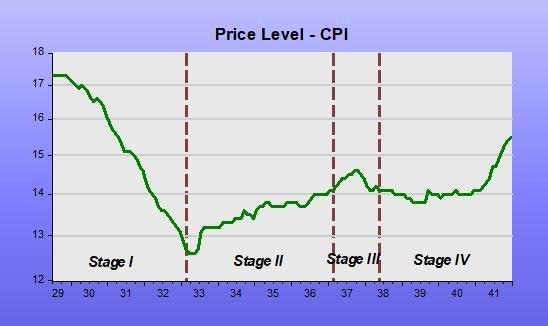
How did the price level behave through the different stages? The next chart gives the details. Stage I witnessed a big drop in prices (deflation). In Stage II the process stopped and reversed somewhat. Stage III indicates why the Fed worried about inflation and in Stage IV we see the effect on prices of the “defense effort”.
The economic impacts of the monetary errors during the Great Depression were magnitudes larger than the Covid19 impacts. At present, the Fed was quick in “adjusting the thermostat”, as I indicate in my last post. However, like in 1937, inflation concerns are proliferating…
PS: George Selgin has pointed me to this recent article he wrote about the “teachings of the Great Depression” to the present situation.
Arbor Research reconstructed the CRB Index by month, back to January 1749. Used as an inverse indicator of the real value of the USD, the CRB Index explains all of U.S. economic history, including the Great Depression.