The “money war” is back on. To an “old-time monetarist” like Steve Henke, money is “everything”. To an “old-time Keynesian” like Paul Krugman, money “means nothing”
The “key shot” from Steven Henke´s article:
To get a handle on how the economy works and where it’s going, one needs a model of national income determination. A monetary approach to this is what counts. Indeed, in a fundamental sense, it’s a theory of everything. The close relationship between the growth rate of the money supply and nominal GDP is unambiguous and overwhelming.
The “key shot” from Krugman´s article:
And while it took a while, my sense is that by 2014 or so the great majority of economic commentators had accepted that looking at the money supply in the U.S. context offered basically no information about future inflation.[or nominal GDP]
There is a solution to these opposing views. More than a decade ago, Nick Rowe gave the perfect interpretation of Milton Friedman´s Thermostat Analogy (where M=money supply growth & V= velocity)
Milton Friedman's Thermostat
If a house has a good thermostat, we should observe a strong negative correlation between the amount of oil burned in the furnace (M), and the outside temperature (V). But we should observe no correlation between the amount of oil burned in the furnace (M) and the inside temperature (P [or NGDP]). And we should observe no correlation between the outside temperature (V) and the inside temperature (P).
An econometrician, observing the data, concludes that the amount of oil burned had no effect on the inside temperature. Neither did the outside temperature. The only effect of burning oil seemed to be that it reduced the outside temperature. An increase in M will cause a decline in V, and have no effect on P.
A second econometrician, observing the same data, concludes that causality runs in the opposite direction. The only effect of an increase in outside temperature is to reduce the amount of oil burned. An increase in V will cause a decline in M, and have no effect on P.
But both agree that M and V are irrelevant for P. They switch off the furnace, and stop wasting their money on oil.
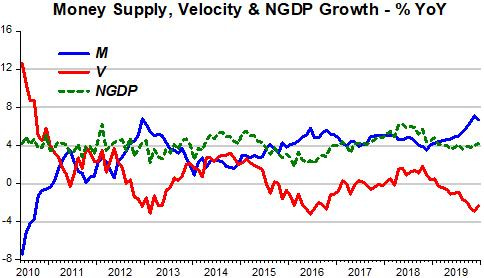
The chart below, provides a nice empirical illustration of the “Thermostat” at work. During the 10 years following the end of the “Great Recession” (GR), NGDP growth (“inside temperature”) was quite stable (this can also be verified for the 20 years during the “Great Moderation” (GM)). During this time, M and V are negatively correlated. That´s what a good “thermostat” (monetary policy) is supposed to do to keep the “inside temperature” (NGDP growth) stable.
Note, for example, that in 2010-2011, the “offset” to the change in velocity (“outside temperature”) was almost perfect. The result is an almost perfect stability of NGDP growth (“inside temperature”).
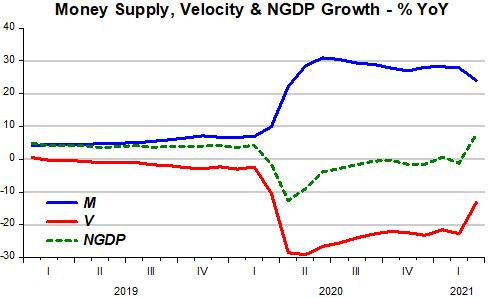
The next chart “zooms in” on the last year (2019) and adds the following 15 months.
When the pandemic hit, there was a sudden and abrupt fall in V. The “fireman” (Fed) was “shockingly surprised”, but quickly reacted by throwing oil into the furnace to stop the “inside temperature” from dropping even more and rapidly was pushing it up. According to the latest available information (March), since the Fed wants to get the “inside temperature” up, it is far from fully offsetting the rise in the “outside temperature” (V).
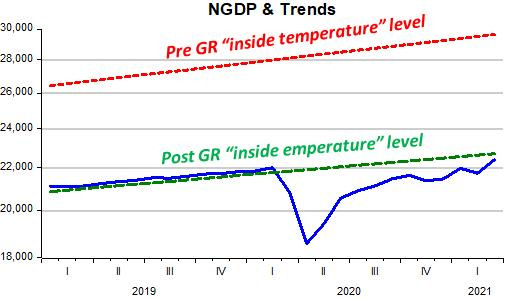
There´s also a level chart to accompany the “inside temperature” flow chart above.
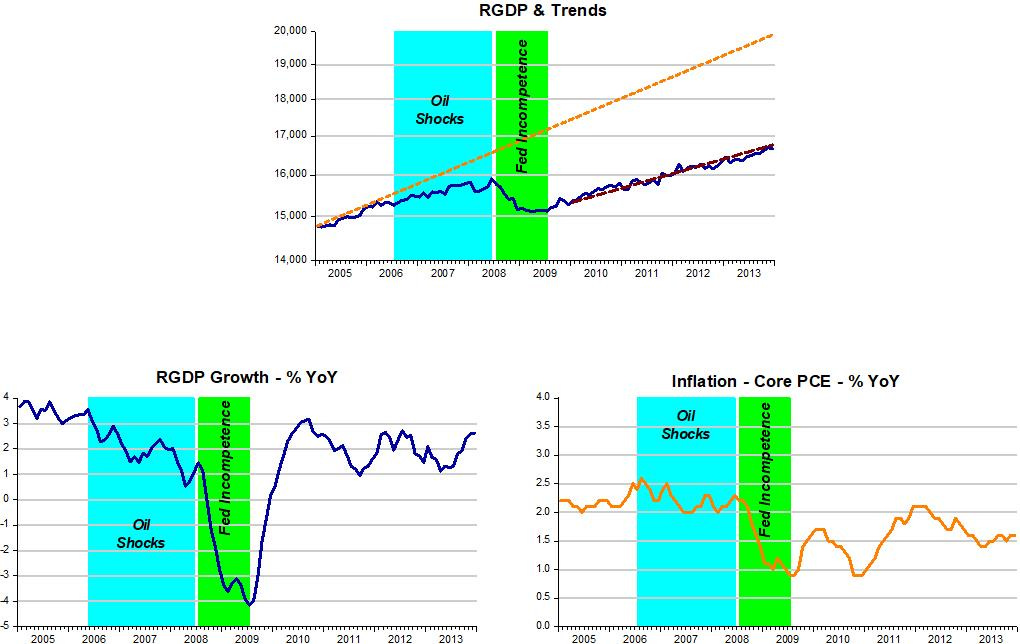
Before “speculating” how things can evolve from here on, in particular what might be the breakdown of the “inside temperature” (NGDP growth) between inflation and real output growth (RGDP growth), let´s see what actually happened (and why) around the time of the last big shock (the “GR” of 2008-09).
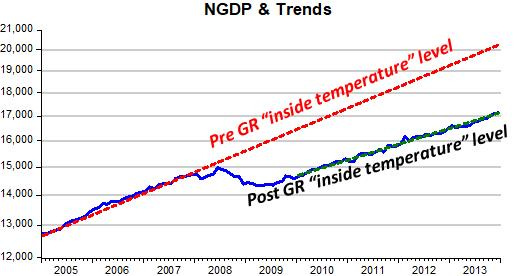
The working of the “Thermostat” for different times are annotated on the charts. Note that when the “fireman” “took oil out of the furnace” when the outside temperature dropped, the “inside temperature” “froze”! When the “outside temperature” (V) began to rise, the Fed was “smart” enough not to fully offset it, allowing the “inside temperature” (NGDP growth) to rise to the Fed´s “desired rate”, where it was maintained thereafter.
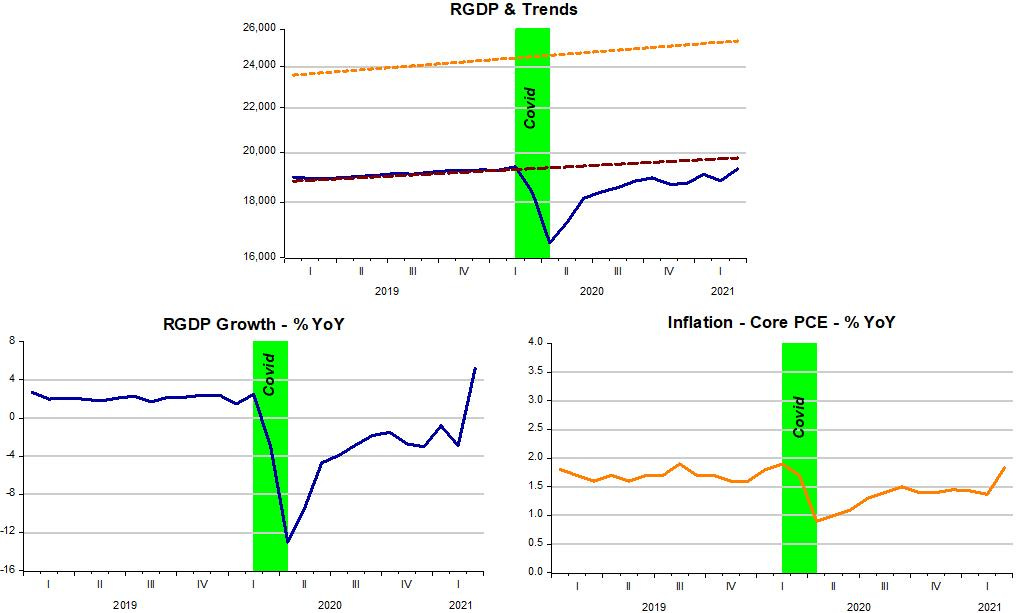
The corresponding “temperature level” chart for the whole 2005-2013 period is instructive. When the “inside temperature” (NGDP growth) “froze”, the “inside temperature level” dropped. Thereafter, while it allowed the “inside temperature” to rise, the “inside temperature level”, never got as “warm” as it was before the “thermostat” began to sputter. This contrasts with what we see at present, where the “inside temperature level” is almost back to the post GR “inside temperature” level!
Why the “Thermostat” (Fed) behaved so differently now & then? My preferred explanation is that the GR was “Fed induced”, while 2020 was “virus induced”. So, if the Fed fully corrected its “mistake” of 2008, people would acknowledged the Fed had been incompetent. That wouldn´t do, especially since the Fed was getting all the accolade for having avoided a second Great Depression. Bernanke was even hailed “The Hero” and “Person of the Year, allowing him to publish a book titled “Courage to Act”!
Better to say “it´s The New Normal” (or “Secular Stagnation”)!
What was the breakdown of the “inside temperature” (NGDP growth) during the GR and its aftermath? I highlight two periods; the oil shocks and what I call “Fed Incompetence”. That “incompetence” refers to the mismanagement of the “Thermostat” (monetary policy), allowing the economy to “freeze-up”.
During oil shocks, it is to be expected that real growth slows down and inflation ticks up. The effects of the oil shocks will be minimized if the “thermostat” manages to keep the “inside temperature” relatively stable. That mostly happened, until the Fed “lost its way”.
When the Fed “warmed-up” the economy, although the “inside temperature level” remained “forever” lower, RGDP growth picks up, and so does inflation. But inflation remained, for most of the time, well below the 2% target.
Like now, during the GR there was also a lot of “inflation mongering”. A couple of examples:
Feldstein (2009):
The unprecedented explosion of the US fiscal deficit raises the specter of high future inflation.
Plosser (2009)
Plosser's own economic model has inflation rising above 3% in 2010 and 4% in 2012 if the Fed doesn't act. Even if the Fed does act, Plosser sees inflation hitting 2.5% in 2011, significantly above its target.
What´s the situation at present? With the Fed “cranking-up” the “thermostat”, with M not fully offsetting the rise in V, as we saw above, the “inside temperature” is warming up. As I write, it could be that the level of RGDP has hit the previous trend level path.
Inflation has climbed to the average rate of the pre pandemic years, but is still below the 2% target (Core PCE inflation is used as “guide” given the high volatility of the headline measure). Given the new framework of AIT, if inflation climbs above 2% for a period of time, that should be “good” since the new framework calls for exactly that.
The Fed appears not to be satisfied with taking the economy just to the post GR level, but somewhere between that level and the Pre GR trend. It has the means (the “thermostat”) to do that. To be able to use it “productively”, however, it must be aware of its existence. About that, I have my doubts, seeing too much said about “potential” measures, which no one knows what they are by a long mile.
Notes: The money supply measure used is that provided by the Divisia M4 broad money index, available from the Center for Financial Stability.
The monthly GDP figures are available from IHS Markit


