How Does Monetary Policy Work?
As Seen Through Analogies, Metaphors & Pictures

The standard (textbook) definition of monetary policy runs something like this:
“Central bank actions that alter the money supply or interest rates to influence aggregate demand and achieve macroeconomic goals”
How it works is implicit in the definition: Through money and interest rates. But that´s clearly vague.
Some analogies/methaphors try to give it some life:
Barge Navigating a River—Alan Greenspan (1995)
“Monetary policy acts with a lag. If we had waited until inflation had become evident, it would have been too late. The oft-cited analogy to a barge travelling on a river is apt.To successfully navigate a bend in the river, the barge must begin the turn well before the bend is reached. Even so, currents are always changing, and even an experienced crew cannot foresee all the events that might occur as the river is being navigated.”
It seems Greenspan is implicitly saying that monetary policy works through interest rates, with a delay.
The Long Rope—David Altig (2009)
“I have a simple way of thinking about how monetary policy works. Imagine a long rope. At one end of the rope are short-term, relatively riskless interest rates.Farther along the rope are yields on longer-term but still relatively safe assets. Off at the other end of the rope are multiple tethers representing mortgage rates, corporate bond rates, and auto loan rates—the sorts of interest rates that drive decisions by businesses and consumers.
“In the textbook version of central banking, the monetary authority grabs the short end of this allegorical rope, where the federal funds rate resides, and gives it a snap. The motion ripples down and hopefully reaches longer-term U.S. Treasury rates, which then relay the action to other market interest rates, where the changes reverberate throughout the economy at large.”
This clearly says monetary policy works through interest rates, with the delay defined by the time it takes for the snap to reach all the relevant rates.
Irrigating a Farm—Christopher Hayes, modified by Neil Irwin (2010)
Hayes: “If the nation were a farm . . . the Fed would be the agency in charge of water and irrigation. Its job is to keep water (money) flowing enough to maximize crops (strong job creation), but not pump in so much water as to cause flooding (inflation). We’re currently in an extreme drought (a deep recession), but the Fed is refusing to pump in more water because it’s afraid that doing so will cause flooding down the road.”Irwin: “I think it’s a useful and apt way of thinking about things up to that point, but I do think that in the segment Hayes could have expanded the metaphor further to more fairly reflect the predicament the Fed is currently in. So here’s my effort to do that.
“This drought is so bad that the Fed has already drained its main reservoir completely (cut the federal funds rate to zero). So if it’s going to take new efforts to water the fields, it has to find more water through some unconventional means, such as by airlifting water in by helicopter, or piping it in from a nearby lake. (These are the equivalents of quantitative easing, or buying Treasury bonds and other securities to increase the money supply and drive down long-term interest rates).
“The problem is, while the Fed has lots of experience and knowledge about how the controls on its normal reservoir work and how much to open the valves to get the right amount of water onto the fields, these other tools are untested. If they pipe water in, they’re not sure how much will get to the fields–it might be too little to do much good, and it might be so much as to cause flooding.”
Clearly a monetarist framework (after the interest rate instrument “fails”): “Too much money chasing too few goods” (or the inverse).
And the best for last:
The Thermostat—Milton Friedman (2003)
“The contrast between the periods before and after the middle of the 1980s is remarkable. Before, it is like a chart of the temperature in a room without a thermostat in a location with very variable climate; after, it is like the temperature in the same room but with a reasonably good though not perfect thermostat, and one that is set to a gradually declining temperature. Sometime around 1985, the Fed appears to have acquired the thermostat that it had been seeking the whole of its life.”
Friedman´s “thermostat” is the analogue of the equation of exchange in growth form: m+v=p+y, where m is money supply growth, v is the growth in the velocity of money (inverse of money demand), p the rate of inflation and y is real output growth.
In this case, p+y is NGDP growth (or the “inside temperature”), that one wishes to keep as stable as possible. v is the “outside temperature” (determined “outside”, and over which the monetary authority (Fed) has no direct control. m is the “thermostat”, which the Fed “dials up or down” to offset changes in the outside temperature (v) in oder to keep the “inside temperature” (NGDP growth) as “stable as possible”,
Interestingly, the only analogy/metaphor that´s “perfectly translatable” to pictures based on actual data is the “Thermostat Anology”.
The first batch of pictures shows the workings of the thermostat (monetary policy) during different periods for the past 30 years.
Note in the charts that when the Fed appropriately “dials the thermostat” - adequately offsetting changes in velocity (“outside temperature”) - NGDP growth (“inside temperature”) remains relatively stable.
When mistakes are made, usually by the Fed letting (by not adequately offsetting changes in velocity) the “inside temperature” fall a “little” or “a lot”, NGDP growth drops, by a “little” or “a lot”.
The post Covid period is different because the Fed “dialled the thermostat up” strongly, causing the “inside temperature” to become “too hot” (NGDP growth rises strongly). The shaded areas denote recessions.

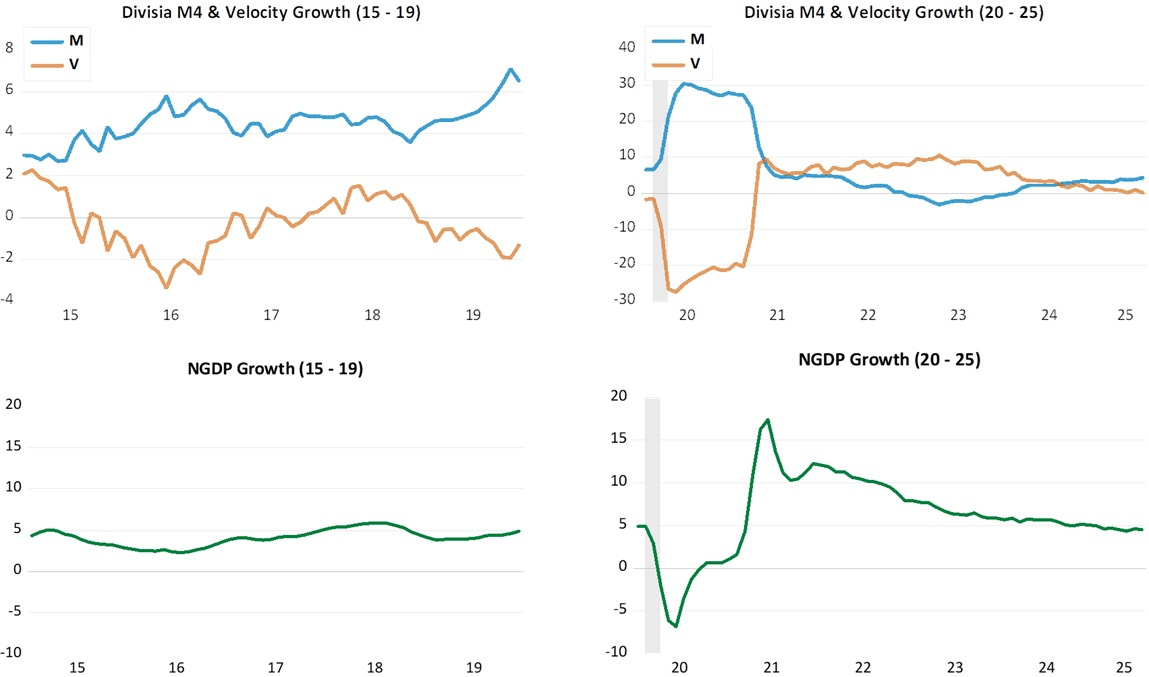
Looking at the first LHS chart above (for the period 92-05), the expansion following the short and shallow 90/91 recession lasted 120 months, during which it seemed, as noted by Friedman, the Fed had acquired the “thermostat” since NGDP growth was very stable.
Note, however, that Greenspan in 1995, well into the stable period, was talking about the difficulties of “navigating a barge”. What this tells me is that what the Greenspan Fed was doing was “unconsciously” adequately controlling the thermostat, changing the money supply to offset changes in velocity.
But because that action was “unconscious”, the Fed was prone to make mistakes, which it did, resulting in the 2001 recession.
It got worse after Bernanke took over the Fed in January 2006. By “lazer-focusing” on the partial indicator that is inflation, the Fed “tanked” the economy, with NGDP growth turning significantly negative for the first time since 1938!
In other posts I have detailed Bernanke´s “inflationphobia”. Here I´ll exemplify with Charles Plosser (who passed this past August), a famous macroeconomist, the one who coined the term “Real Business Cycle” and was president of the Richmond Fed from 2006 to 2015.
From July 2008, and at least once every year all the way to 2014, Plosser would warn us about the risk of a take-off in inflation if the Fed did not begin to tighten (raise the Fed Funds rate). I´ll just note the first and last “warning”.
In July 2008, just at the time NGDP growth was about to plunge, he said:
In sum, this year and next will be quite challenging. The economy will grow this year but at a slow pace, and the unemployment rate is likely to get worse before it gets better. At the same time, inflation will be uncomfortably high for a while.
I am more optimistic about the outlook for 2009 and I expect we will see economic growth return to near its longer-term trend. But to prevent recent inflation from continuing to plague the economy and to avoid a rise in inflation expectations, I believe the current very accommodative stance of monetary policy will need to be reversed, and depending on how economic conditions evolve, I anticipate that this reversal will likely need to begin sooner rather than later.
In July 2014:
Plosser, speaking in a Bloomberg Television interview with Michael McKee in Jackson Hole, Wyoming, said “we are closer than a lot of people might think” to the first interest-rate increase since 2006. If the Fed waits too long, he said, “we’ll lose credibility. We may lose control of inflation.”
He must have been very frustrated sounding like a “scratched vinyl record”. During his 9-year tenure, he never was able to vote for a rate increase, but “had to vote” for about 10 rate decreases! He left the Fed in March 2015. The first rate increase came in December of that year.
The thing to notice from the charts for the 2006-14 and 2015-19 periods is that from the end of the Great Recession in mid-09, NGDP growth was again stable, although at a lower “inside temperature” (lower NGDP growth rate).
Later, I´ll show level charts and this nuance will become clear.
Moving to the bottom RHS chart, it is clear that the fall in velocity (outside temperature) when Covid hit was sudden and deep. The Fed´s reaction was quick, but not quick enough, so the “inside temperature” initially dropped to “freezing”.
The Fed quickly “dialled-up” the thermostat so that money supply growth rose rapidly and so did the “inside temperature”. In 2020, several economists, observing the rapid rise in money supply growth, forecasted a significant increase in inflation.
That forecast proved correct but for the wrong reason. Inflation picked up above the 2% target only after velocity growth increased and money supply growth was not “dialled down” sufficiently to offset it.
Later, as the chart shows, velocity stabilized while money supply growth fell, even turning negative for a while. With that, NGDP growth converged to a stable rate.
Was the increase in inflation in 2021-22 the result of a monetary policy “mistake” as many believe? I think mostly not and will discuss that point below, after presenting the level charts.
Why looking at levels is important? For example, above we showed how “good monetary policy” keeps NGDP growth stable. We also saw that when monetary policy falters NGDP growth may fall, sometimes significantly.
When we look at the level of NGDP we can ascertain if the Fed was successful in correcting its mistake, bringing NGDP back to the trend path.
For example, the general “complaint” that the post Great Recession period felt more like a “depressed stability” (described in the “Irrigating a Farm” analogy described above) is evidence that the Fed did not correct its initial mistake.
The level charts below cover the same period as the charts showing the determination of NGDP growth above.
They represent the trend level path of NGDP and the trend level path of prices.
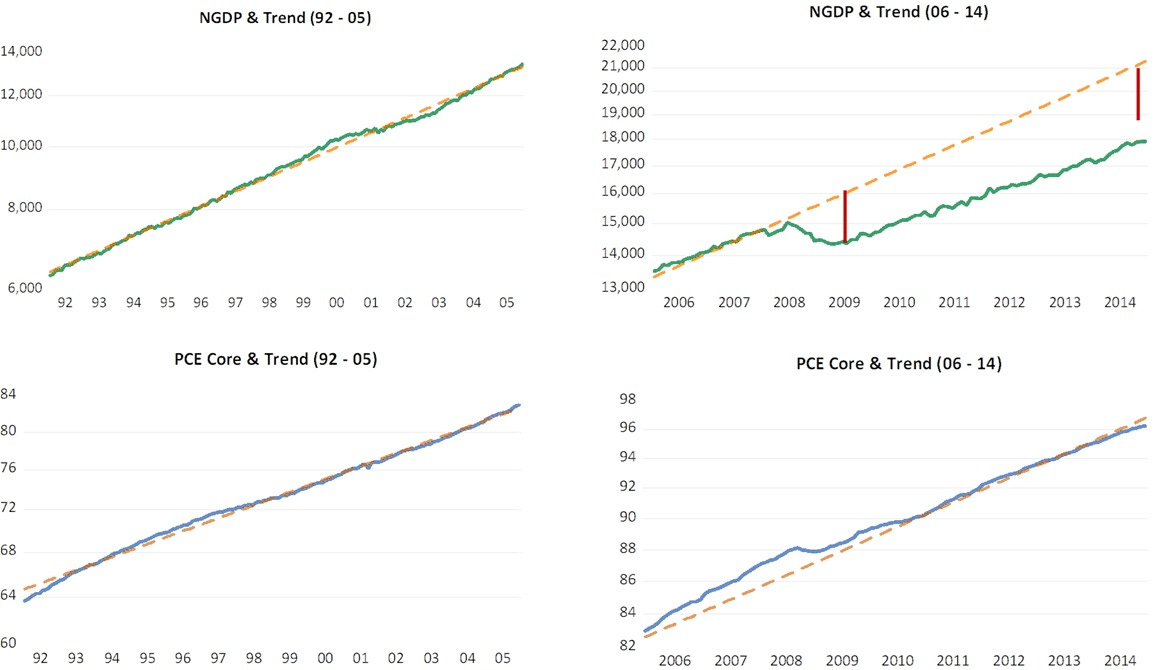
The top LHS chart shows that in the 92 - 05 period NGDP remained close to its trend path, implying that NGDP was growing at a stable rate (close to 5%). The PCE Core price level was rising (inflation) at close to the 2% target rate)
Note, in the top lower RHS chart that, due to a significant oil price shock which lasted to mid-2008, the price level rose above the trend path, implying inflation was higher than 2%.
Given his “inflationphobia”, Bernanke was very worried. In the June 2008 FOMC Meeting he concludes:
I’m also becoming concerned about the inflation side, and I think our rhetoric, our statement, and our body language at this point need to reflect that concern. We need to begin to prepare ourselves to respond through policy to the inflation risk; but we need to pick our moment, and we cannot be halfhearted.
The “rhetoric, statement and body language” “worked” because inflation went even negative for a short period, enough to bring the price level back close to trend.
To get that result, however, Bernanke “crashed” the level of NGDP (as seen in the first chart, NGDP growth turned significantle negative). The rate of NGDP growth following the end of the Great Recession is also lower, illustrated by the fact (see the two equal lenght vertical bars) that the actual level of NGDP distances itself from the original path.
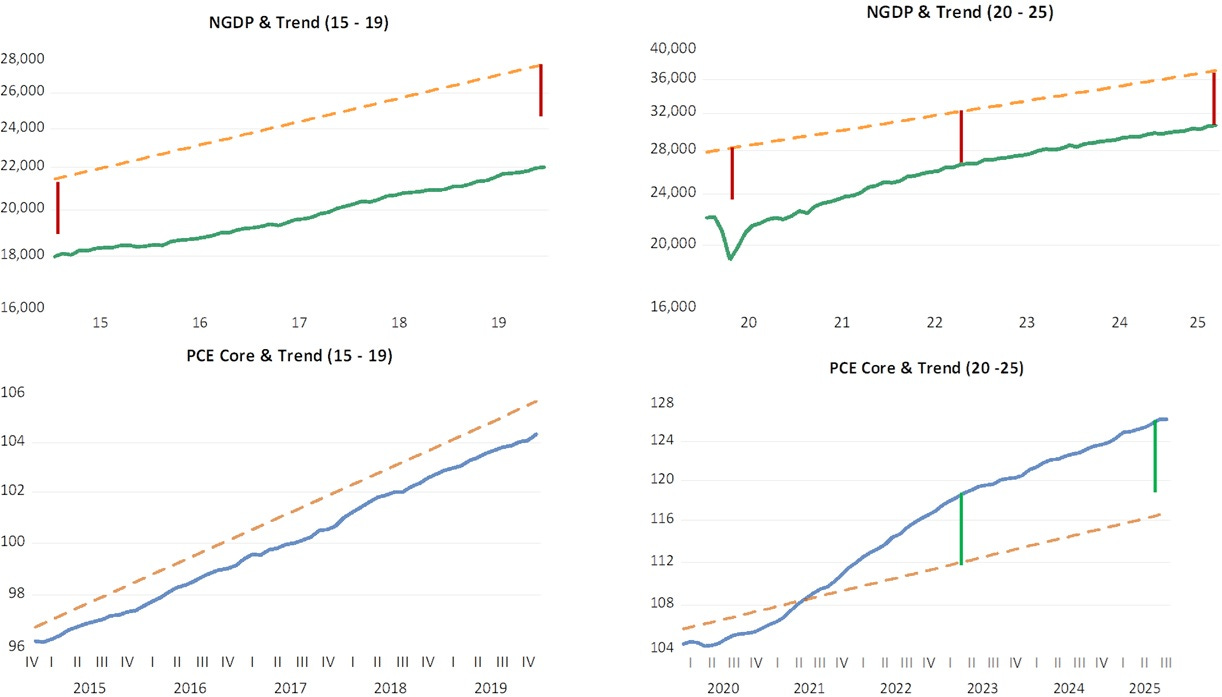
The “substandard” performance of NGDP (both its level and growth rate) happened because there was never any effort to take NGDP back to the trend level path. This continued over the 2015-19 period. While the price level was below the original path, inflation (the growth rate of the price level) was only slightly below the 2% target.
Covid changed everything!
We saw before that velocity crashed (money demand exploded). The Fed´s reaction was appropriate and it managed to take NGDP back to the post Great Recession lower trend level path.
Inflation increased after early 2021 because the Fed continued to expand money supply while velocity began to rise, inducing an increase in NGDP growth. The question is: why did the Fed do that?
Market Monetarists say that the Fed should target NGDP-Level Targeting. So, once NGDP went back to the post Great Recession trend, monetary policy should have worked to keep it there. Since the Fed didn´t dial down the growth in money supply sufficiently to offset the rise in velocity, NGDP growth was “excessive”.
Imagine that before Covid happened, NGDP growth was rising along trend a bit below 5%. When Covid hit, NGDP growth went to close to -7%. To bring NGDP back to the trend path, NGDP growth would have to rise by close to 12%. But NGDP growth went up by 17%. It was this “excess” NGDP growth that caused the rise in inflation.
This reflects the general problem associated with rigid rules.
Strict NGDP Level Targeters would say: “Maintain NGDP on trend regardless. Let markets adjust. Don’t accommodate supply shocks.”
That works for simple supply shocks (oil prices, tariffs), but Covid wasn’t a simple aggregate supply shock - it was a massive sectoral reallocation shock. In this case:
Strict NGDP targeting would have been too tight
Some temporary NGDP overshoot was actually optimal
Because it facilitated the relative price adjustment without forcing nominal price/wage declines
And that is what the Fed actually did:
Let NGDP overshoot (accommodative policy)
Allowed aggregate price level to rise
This meant:
Goods prices rose significantly (high demand)
Services prices rose modestly or stayed flat (but didn’t need to fall nominally)
Relative price adjustment accomplished via differential inflation rather than deflation (and likely renewed recession).
Services sector workers could find new jobs without nominal wage cuts
In other words, NGDP targeting isn’t quite as “robust” to all types of shocks as advertised! Discernment by a thoughtful Fed is always necessary. (this discernment is what Bernanke lacked in 2008!)
Looking at the level chart for the post Covid period (2020-25), we observe that after rising for the reason stated, inflation has fallen, but is still a little above the 2% target, despite the fact that NGDP is rising at a rate close to the original ~5% and is closer to that original path level than before.
(I must emphasize that there are measures of inflation, particularly the Harmonized Index of Consumer Prices (HICP), which is the same as the headline CPI but excludes Owner´s Equivalent Rent (OER), that are much closer to the 2% target).
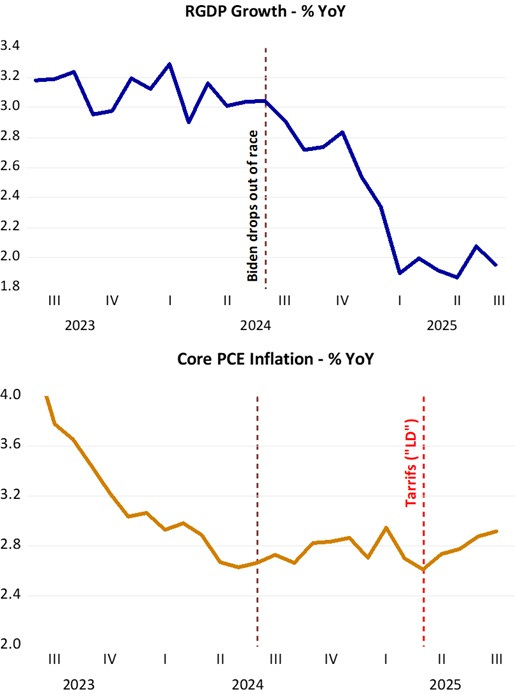
I´m not very hopeful for the near term. Powell, who showed discernment (despite the many who accuse him of having made important “mistakes”), is likely to be replaced by the very “undiscerning” Kevin Hassett.
Kevin Hassett recently said in an interview:
…we´re making progress but it will take a little bit more time for the hole Biden dug to be completely filled.
Talking about “holes dug”, coincidentally (or not), it was at the time Biden dropped off the presidential race in late July 24, increasing the chances of Trump winning, that real growth began to fall and inflation stopped falling (beginning to rise after “Liberation Day”!
The FED's Ph.Ds. don't know a debit from a credit. All monetary savings originate within the confines of the payment's system. As TDs grow, DDs are depleted, dollar for dollar.
C--19 was already in the works. Powell dug a hole for himself. As I said: "The 4th qtr. 2019 is not the problem. The 1st qtr. 2020 will be negative." Nov 26, 2019.