We shouldn´t be discussing "hard" or "soft" landings
but rather if the Fed can provide a "smooth" ride going forward

“Landing alternatives” have been a hot topic of discussion lately. Although there are several takes, I only highlight Olivier Blanchard´s in “Why I worry about inflation, interest rates, and unemployment”.
UNCOMFORTABLY LIKE THE 1970S
Let me begin with a graph that was motivated by the highly relevant forthcoming book by Alan Blinder on soft and hard landings, which he discussed at Princeton's Markus Academy in February 2022.
Blinder looks at Fed tightening episodes since 1965. He identifies 11 episodes and excludes 2 (the global financial crisis and the COVID-19 crisis) where what happened to activity clearly did not come primarily from monetary tightening. He concludes that there was a soft landing in 6 of the remaining 9 cases, and a harder landing in the other 3. I read his implicit bottom line as optimistic and in line with the Reifschneider-Wilcox piece: We can probably land softly from where we are today.
I am not convinced. I think that, in most of the episodes Blinder has identified, the movements in inflation to which the Fed reacted were too small to be of direct relevance to the current situation, and the only comparable episode to today, if any, is the episode that ended with the Volcker disinflation of the early 1980s.
I find that a scary comparison. The figure below shows why. It plots the core inflation rate (in red) and the real policy interest rate (in blue), constructed as the federal funds rate minus core inflation over the previous 12 months. (The results would be even more striking if I had used headline inflation, but, for the usual reasons, we want a series that removes, at least in part, the transitory components of inflation.)
The comparison with the 1970s should already have “turned your nose”. Also, when Blanchard mentions that Blinder excludes the (so called) GFC, more aptly named the “Great Recession”, from his analysis of tightening episodes to consider because “what happened to activity clearly did not come primarily from monetary tightening,” the rest of the analysis becomes highly suspect!
That, however, is a common error made by those who see movements in the Fed policy rate as defining the stance of monetary policy. Although the policy rate was falling (and ended 2008 at “zero”), the economy was experiencing the tightest monetary policy since the 1930s, with aggregate nominal demand (NGDP) growth taking a “nose dive” deep into negative territory.
And that was the result of Bernanke´s “deep horror” of “high” headline inflation resulting from the strong negative oil shock!
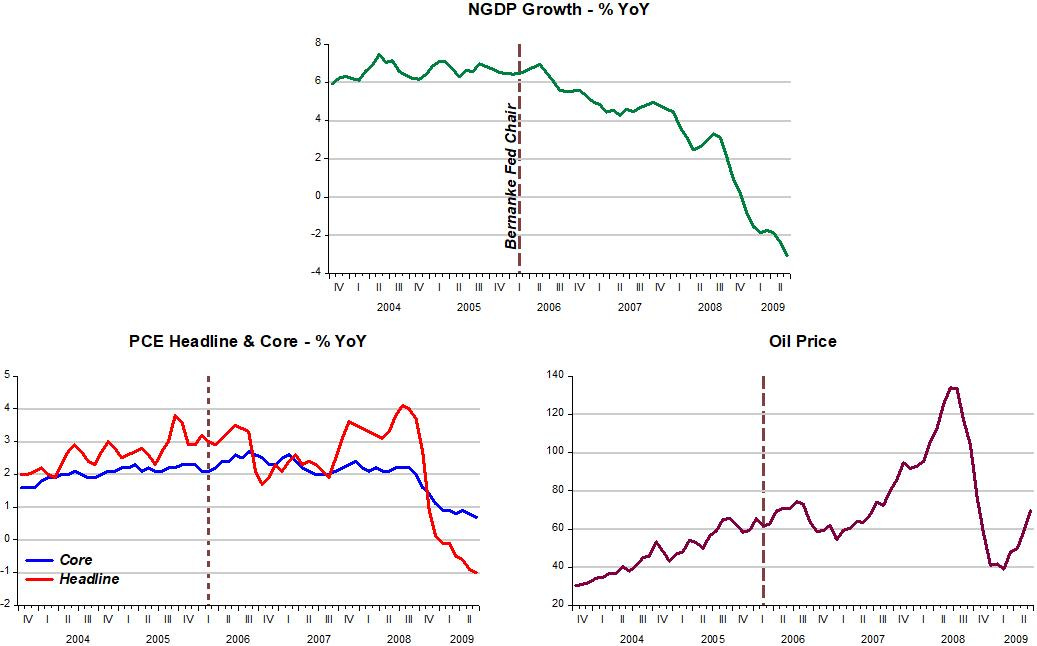
So, ironically, Blinder excludes from his sample the hardest of “hard landings” the Fed undertook since the 1930s!
The rest of Blanchard´s analysis is, unsurprisingly, very New Keynesian discussing “wage catch-up”, “anchoring of inflation expectations”, “flatness of the Phillips Curve” and “price setting”.
David Glasner writes to “calm Blanchard´s nerve” concluding:
Professor Blanchard posits simple sectoral equations for the determination of the rate of wage increases and for the rate of price increases given the rate of wage increases. This sort of one-way causality is much too simplified and ignores the fundamental fact all prices and wages and expectations of future prices and wages are mutually determined in a simultaneous system. One can’t reason from a change in a single variable and extrapolate from that change how the rest of the system will adjust.
Larry Summers butted in very recently, agreeing with Blanchard:
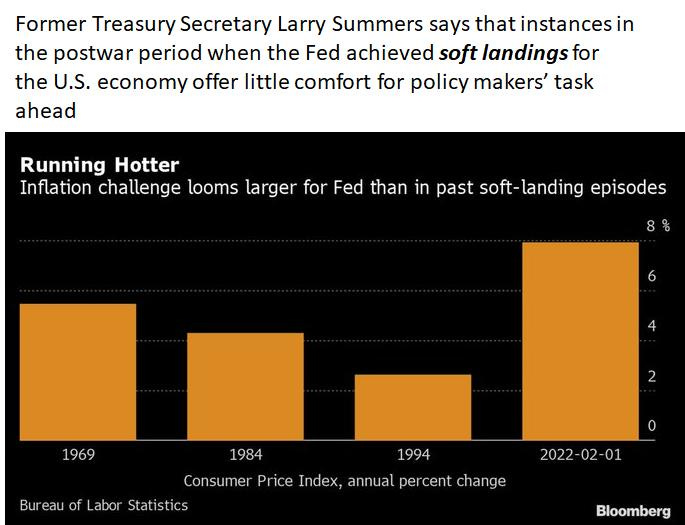
What Summers (and Blanchard) miss is that it is not the level of inflation that matters but its nature, i.e. if it´s “demand or supply propelled”.
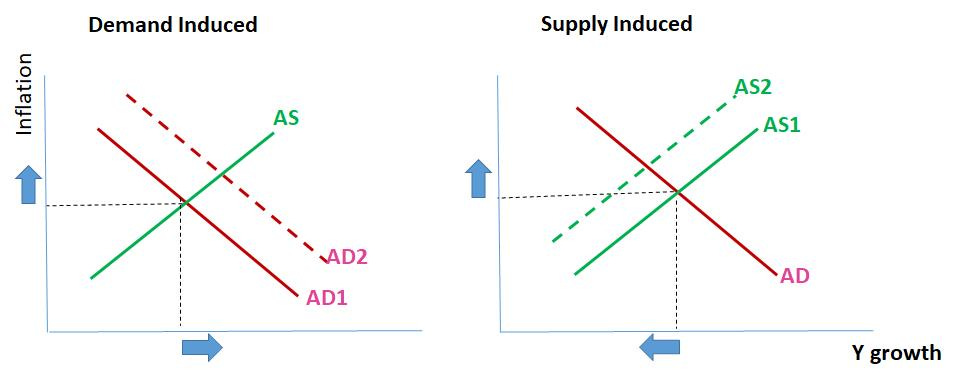
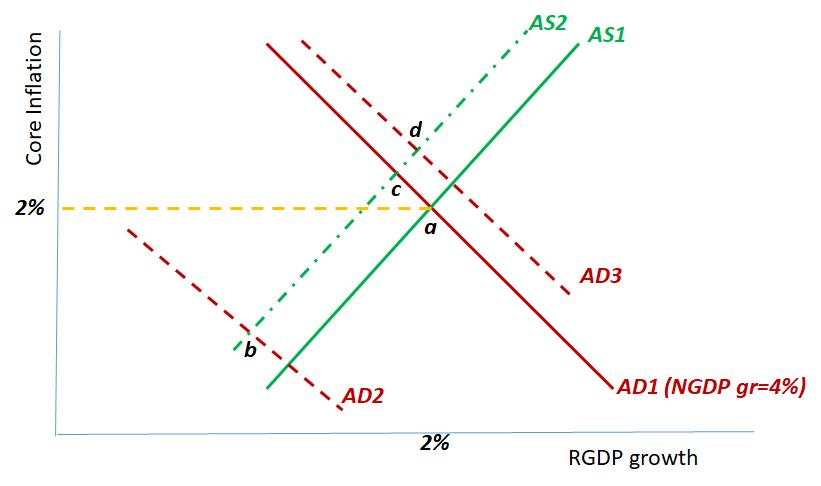
The dynamic AS/AD model provides a good illustration. The curve is viewed as a rectangular hyperbola, meaning that along the curve AD growth (or the sum of inflation and real growth) is constant.
If inflation rises because of a demand shock, real output growth will move in the same direction. When inflation rises due to a supply shock, inflation rises and real growth falls.
If the Fed tries to control inflation due to a supply shock, by shifting the AD curve down and to the left, real growth will fall by more, potentially leading to a recession (example of “hard landing”). The best it can do is to keep AD (or NGDP) growth stable and “wait” for the supply shock to dissipate.
With that in mind, we can draw a stylized representation of the “Pandemic shock”. It was both a supply AND demand shock. Lockdowns/supply chain constraints shifted the AS curve up and to the left, while a mammoth drop in velocity (increase in money demand) shifted the AD curve far down and to the left.
The combination of the two shocks took the economy from point a to point b, resulting in a massive fall of both nominal and real output of -14% and -13% respectively. Inflation also dropped immediately.
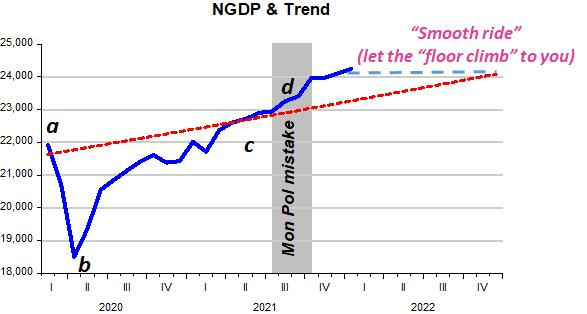
Over time, monetary policy was sufficiently expansionary to take the economy from point b to point c. If the Fed had stopped there it would have gotten an A for a stellar job done. Unfortunately it went “overboard”, increasing AD to point d. With that mistake, inflation was pressured.
The “real world” counterpart of the stylized chart above, is the level chart for NGDP and RGDP presented below, with points a, b, c and d noted. Points c and d refer to intervals of alternative stable NGDP growth.
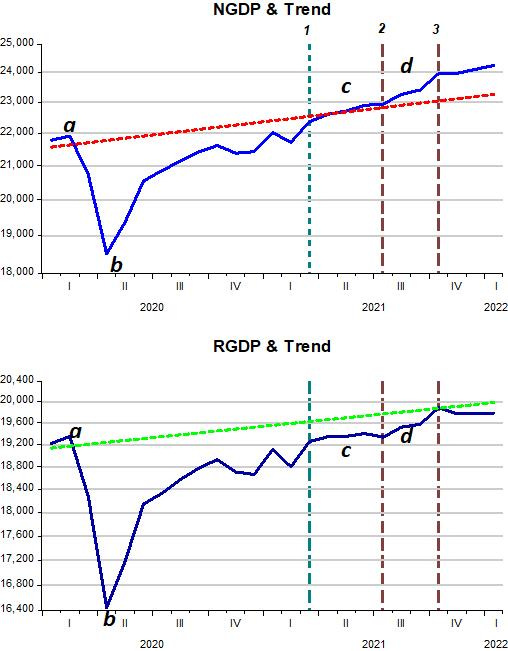
The two charts above tell us that the the Fed did a stellar job, since by March 2021, just 13 months after the February 2020 peak, it had engineered a full recovery of the economy (c) given the supply constraints present. Between July and October 2021, however, it erred by adopting an overly expansionary monetary policy (d).
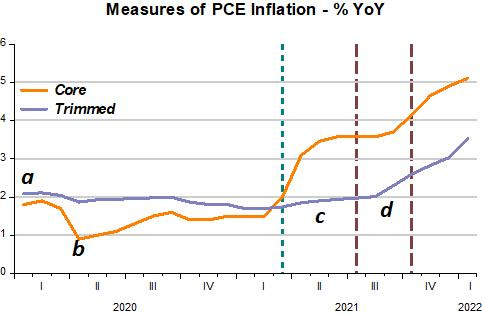
The next chart is illustrative because it “confirms” our dynamic AS/AD model. Note that when AD (NGDP growth) gets back to trend (area c), RGDP remains below trend, reflecting the ongoing supply shock. As the model tells us, RGDP falls AND inflation increases.
If monetary policy had remained “neutral”, all would be well! The rise in inflation was unavoidable anyway and the best monetary policy could have done was to keep NGDP on trend. With the waning of the supply restrictions, the AS curve would shift down and to the right and the economy would converge to point a on the stylized chart of the pandemic shown earlier. A very “soft landing” would have taken place!
The Fed´s mistake took the economy to area d. The resulting increase in NGDP growth increased both inflation and RGDP (as the dynamic AS/AD model predicts). So now, the Fed has to make a choice. Should it immediately “correct” its mistake and adopt a contractionary monetary policy (shift the AD curve from AD3 to AD1 in the stylized pandemic chart above), which would reduce the level of NGDP back to trend in the “real world counterpart chart”, thus reducing that part of inflation due to the demand shock, or should it keep NGDP “constant” at the present level, allowing the “demand induced” inflation to fall more slowly?
Since October 2021, NGDP has remained “constant” (~24 trillion), so it appears the Fed has chosen the “gradual path”. In late February 2022, the invasion of Ukraine by Russia and the reactions of many countries to that fact implied a significant supply shock to the world economy, negatively affecting prices of all commodities (not only food and energy) in addition to also affecting supply chains, which are still being impacted by lingering effects of the pandemic.
The most likely outcome will be a further shift up and to the left of the AS curve with the ensuing rise in inflation and fall in real output growth. Given this new supply shock, it appears the Fed is on the correct path. The Fed “owns” some of the inflation that the economy is experiencing, but the larger part of the inflation is (and will be even greater going forward) due to supply restrictions.
In this situation, an explicitly contractionary monetary policy (one that quickly brings the level of NGDP back to trend) will most likely have a minor impact on inflation but could be the harbinger of an unwanted recession. Probably the best the Fed can do is to try and provide the “smoother” ride possible under the difficult environment that will prevail over the next several months.
That would entail keeping the level of NGDP constant. Under that strategy, the annual growth of NGDP would continuously fall until the level of NGDP joins up with the trend path further down the road. The chart illustrates.