Unpacking the Headline
Illustrating the Dynamic AS/AD Model

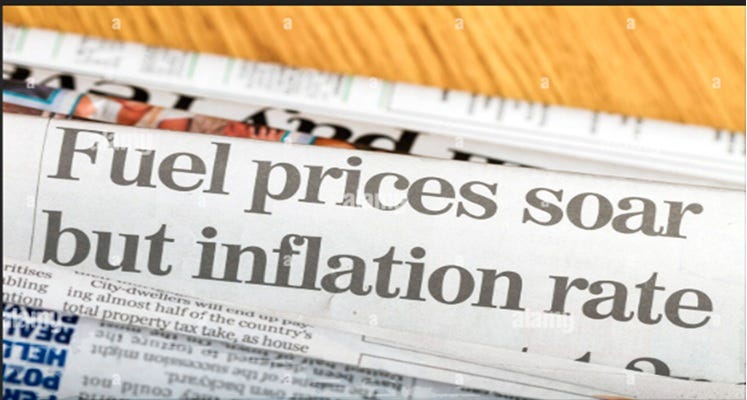
“Global policymakers cannot wave a magic monetary wand and fix a breakdown in the key supply chains for oil and natural gas. All they can do is try to contain the inflationary fallout.”
The war with Iran produced that headline. Since the current episode is still in its early stages, I will appeal to an earlier event that has run its course to unpack what it actually means.
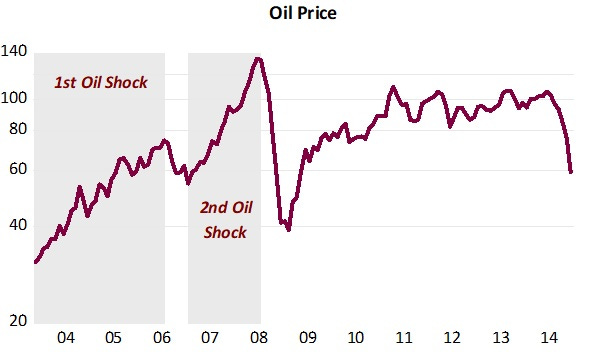
Between late 2003 and mid-2008, the world experienced two back-to-back oil shocks. Their nature was different from today’s: rather than a disruption to supply, they were driven by a significant rise in demand — closely associated with China’s growth and its knock-on effects on developing economies. The oil price chart illustrates the two episodes clearly.
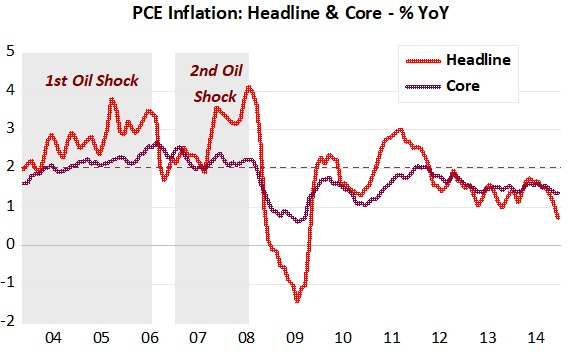
The behaviour of inflation across both shocks is also instructive. As the PCE chart shows, headline inflation rose above target in both cases, while core inflation remained reasonably well-behaved — a distinction that will become central to the argument.
The DASAD model
The Dynamic Aggregate Supply and Aggregate Demand (DASAD) model provides the clearest analytical framework for what follows. In this model, the vertical axis depicts the inflation rate and the horizontal axis shows real output (RGDP) growth.
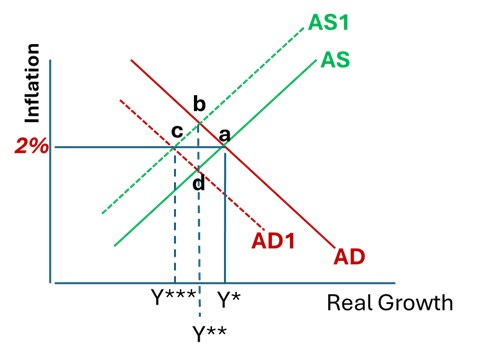
The Aggregate Demand curve represents the growth rate of nominal spending (NGDP): since NGDP growth is constant along any given AD curve, each point on it implies a different combination of inflation and real growth that sums to the same nominal total.
The initial equilibrium is at point a: inflation is at the 2% target, real output grows at its trend rate Y*, and NGDP growth runs at, say, 5% — implying 3% real growth and 2% inflation.
An oil price shock shifts the Aggregate Supply curve up and to the left, to AS1. If the Fed holds NGDP growth stable, the economy moves to point b: inflation rises and real growth falls to Y**. This is temporary. As the supply shock dissipates, AS1 slides back toward AS, inflation returns to 2%, and growth recovers to Y*. This is precisely why many analysts — correctly — argue that the Fed should “look through” supply shocks.
The Bernanke of 1997 versus the Bernanke of 2008
The case for looking through was made forcefully in 1997 by none other than Ben Bernanke himself, in a Brookings Paper co-authored with Gertler and Watson:
Substantively, our results suggest that an important part of the effect of oil price shocks on the economy results not from the change in oil prices per se, but from the resulting tightening of monetary policy. This finding may help to explain the apparently large effects of oil price changes found by Hamilton and many others.
In the DASAD framework, what Bernanke et al. were describing is straightforward: if the Fed responds to the rise in headline inflation by tightening — shifting AD to AD1 — inflation will be held at target, but real growth will fall further, to Y***, potentially turning negative.
Worse, if that tighter stance is maintained after the supply shock dissipates and AS1 returns to AS, the economy settles at point d: permanently lower nominal spending, permanently lower real growth, and inflation below target. The tightening does not merely lean against the shock — it locks in damage.
What actually happened
The NGDP and RGDP growth charts confirm how closely the DASAD model’s predictions track reality. During the first oil shock (2003–06), Greenspan headed the Fed. During the second (2007–08), Bernanke was at the helm.
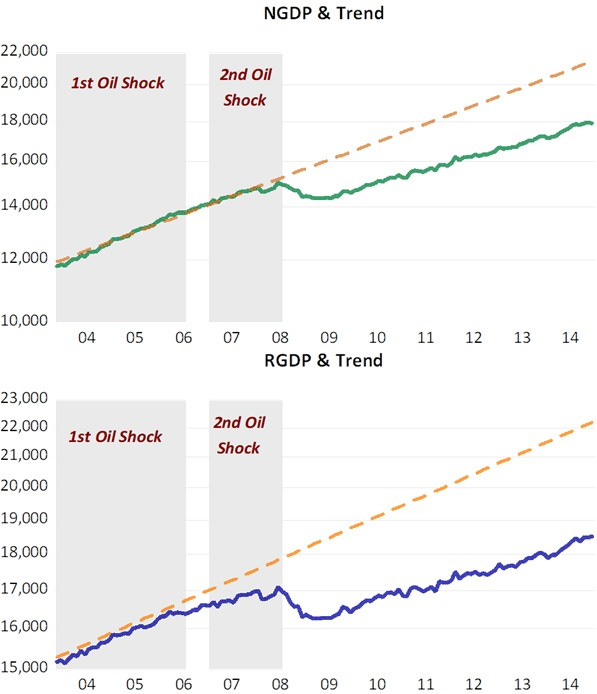
Under Greenspan, NGDP growth remained broadly stable — as if the economy simply moved from point a to point b, with inflation temporarily elevated and real growth temporarily below trend. His September 2005 FOMC statement, issued in the aftermath of Hurricane Katrina and its effect on energy prices, captures the reasoning:
While these unfortunate developments have increased uncertainty about near-term economic performance, it is the Committee’s view that they do not pose a more persistent threat… core inflation has been relatively low in recent months and longer-term inflation expectations remain contained. The Committee perceives that, with appropriate monetary policy action, the upside and downside risks to the attainment of both sustainable growth and price stability should be kept roughly equal.
Note two things: the explicit reference to the stability of core inflation, and the emphasis on “appropriate monetary policy action” — an admittedly elusive phrase, but one that signals a calibrated, two-sided response rather than a single-minded focus on headline prices.
Now compare Bernanke’s summary of the June 2008 FOMC:
I’m also becoming concerned about the inflation side, and I think our rhetoric, our statement, and our body language at this point need to reflect that concern. We need to begin to prepare ourselves to respond through policy to the inflation risk; but we need to pick our moment, and we cannot be halfhearted.
When the time comes, we need to make that decision and move that way because a halfhearted approach is going to give us the worst of both worlds. It’s going to give us financial stress without any benefits on inflation.
There is no mention of core inflation. There is no reference to the distinction between a supply-side price level shift and a genuine demand-driven inflation. The statement reads as the 2008 Bernanke having forgotten what the 1997 Bernanke proved.
Almost immediately, NGDP growth tumbled. As the oil shock dissipated and AS1 moved back toward AS, AD simultaneously contracted to AD1 — exactly the scenario Bernanke’s own 1997 paper warned against. The economy moved to point d: permanently lower nominal spending, permanently lower real growth, a unit root introduced into the output path.
Was any of that monetary tightening necessary? Almost certainly not. The oil shock was already fading. Core inflation was contained. The tightening purchased lower real growth — and, as the subsequent decade demonstrated, purchased it permanently.
Back to the headline
This history is the key to unpacking today’s warning about the Iran war and energy supply chains.
If policymakers respond to supply-driven inflation by tightening monetary conditions — by trying to “contain the inflationary fallout” through demand compression — they will not neutralise the shock. They will compound it. They will purchase lower real growth and higher unemployment in exchange for a marginal reduction in headline inflation that the supply shock itself would have eventually resolved.
The Greenspan playbook — anchor nominal spending, distinguish headline from core, look through the transitory — is available. Whether today’s policymakers will follow it is, as yet, an open question.
Footnote: After completing this post I came across this piece by David Beckworth, which arrives at the same destination by a different, more technical route. If the DASAD framework here is the undergraduate lecture, Beckworth's is the graduate seminar. Readers who want to go deeper will find it rewarding — and will notice, I hope, that the two analyses converge.
You get deeper into the quagmire. The distributed lag effects of monetary flows are mathematical constants. We knew the precise "Minskey Moment" of the GFC:
POSTED: Dec 13 2007 06:55 PM |
The Commerce Department said retail sales in Oct 2007 increased by 1.2% over Oct 2006, & up a huge 6.3% from Nov 2006.
10/1/2007,,,,,,,-0.47 * temporary bottom
11/1/2007,,,,,,, 0.14
12/1/2007,,,,,,, 0.44
01/1/2008,,,,,,, 0.59
02/1/2008,,,,,,, 0.45
03/1/2008,,,,,,, 0.06
04/1/2008,,,,,,, 0.04
05/1/2008,,,,,,, 0.09
06/1/2008,,,,,,, 0.20
07/1/2008,,,,,,, 0.32
08/1/2008,,,,,,, 0.15
09/1/2008,,,,,,, 0.00
10/1/2008,,,,,, -0.20 * possible recession
11/1/2008,,,,,, -0.10 * possible recession
12/1/2008,,,,,,, 0.10 * possible recession
RoC trajectory as predicted.