
The Ludicrous Inflation Debate
The Ludicrous Inflation Debate
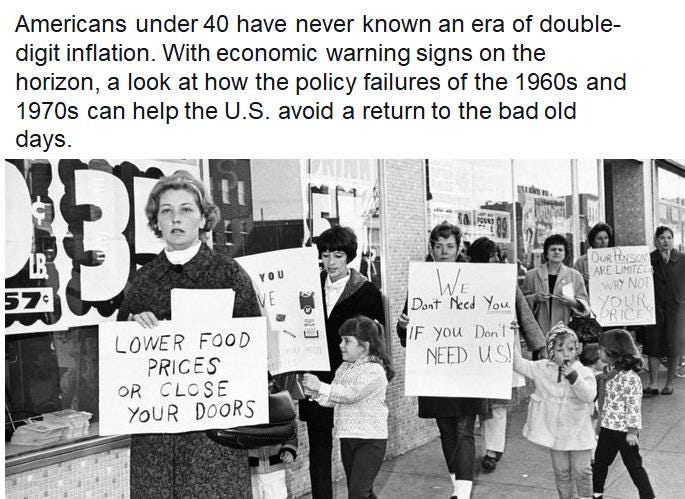
Will we travel back to the 70s?

A pot pourri of inflation views.
Far from signaling the return of significant inflation, temporary price increases are exactly what one would expect in a recovery following an economic shutdown. Whether those peddling inflation fears are pursuing their own agenda or simply jumping the gun, they should not be heeded.
Peter Boockvar
As for the Fed, if the only thing they are going to look at in driving monetary policy is the almost 8 million [workers] that are not back, they are not doing their homework. The economy is running too hot, and stagflationary situations are popping up left and right.
It can't be overstated how much better it is for America's economic problem du jour to be sporadic price spikes and shortages from a too-fast recovery rather than stagnant wages and persistently high unemployment from a too-slow one.
Jason Furman tries a “balanced” approach:
·#1 TRANSITORY: REOPENING PAINS. A lot of the inflation this year has been price spikes in areas like autos. These prices will fall in the future. Other prices have more to rise (e.g., airfares and restaurants) but will max out once the adjustment is complete.
#2 TRANSITORY: SUPPLY IS COMING. Job growth will pick up as COVID cases fall, vaccinations rise, UI rolls off, and things return more to normal. Supply will further be enhanced as bottlenecks for key inputs (e.g., microchips) resolve themselves.
#3 TRANSITORY: DEMAND IS COOLING. People bought all the durables they could in Mar/Apr/May and we'll have the opposite of pent up demand, fiscal stimulus is waning, and businesses are done making up for their losses. (This is the most speculative/uncertain of the four arguments.)
#4 TRANSITORY: EXPECTATIONS ARE ANCHORED. Inflation expectations are around 2 percent and not behaving very differently than they have in the past. Can be seen in the 5yr-5yr breakeven inflation or the Fed's index of Common Inflation Expectations.
#1 PERSISTENT: HOUSING INCREASES ARE COMING. House prices are up sharply, this has barely bled into the large shelter component one the CPI but it will in the form of higher rents and owner equivalent rents.
#2 PERSISTENT: STICKY WAGES/PRICES ARE COMING. Many wages and prices are "sticky," haven't risen yet but they will. Wages will go up not just because of demand but also because some wage setters will adjust next year's raises to this past year's inflation. Will bleed into prices.
#3 PERSISTENT: DEMAND EXCEEDING SUPPLY. The inflation data we have is through May but demand could just have been getting started as people felt safe to consume services (a much larger piece of Core CPI than goods). With excess saving they can afford more of everything.
#3 (con't). Demand will spend the next year above pre-pandemic (even though fiscal stimulus waning it is still much larger than pre-pandemic trend) and supply won't reach pre-pandemic trend (can't get unemployment rate and participation all the way back rapidly).
#4: PERSISTENT: EXPECTATIONS COULD BECOME UNANCHORED. Expectations are sensitive to actual inflation (especially for consumers), the Fed's asset purchases have distorted prices, & perceived regime shift. (This is the most speculative/uncertain of the four arguments.)
WHERE I COME DOWN: In general most professional forecasters seem to be overweight on the all of the arguments for transitory and underweight on all of the arguments for persistent. More room for demand to rise and sticky wages/prices to rise seems under appreciated.
1/Last Jay Powell issue, from the press conference. Powell is asked (by Victoria Guida) @vtg2 where the rise in inflation is going to come from, in the medium term. That is, the inflation scenario Powell seems to envision is that we're going to have a modest burst of inflation...
2/for a few months, inflation will then come back down later in the year, and then somewhere in later 2022 or in 2023, there's going to be a rise in inflation above 2%. So, Victoria is wondering what's going to drive that overshoot. The question's asked in a Phillips curve...
3/context, as if there are 2 choices: it's capacity utilization (or labor market tightness) or it's inflation expectations. Powell says it's capacity utilization that's going to drive the inflation overshoot. In 2018, in a speech, Powell talks about: "...evidence of a very...
4/flat Phillips curve and inflation expectations anchored near 2 percent." Which is pretty much the consensus, among people who continue to take the Phillips curve seriously. So, how do we get this overshoot with a flat Phillips curve? So, it's bad enough that Powell can't...
5/give us a sensible story about how monetary policy is connected to inflation, but at least he could be consistent.
My preferred round-up:
You should immediately distrust any pundit who only discounts the importance of inflation when it’s below 2% (i.e. hawks) and you should also discount any pundit who only discounts the importance of inflation when it’s above 2% (i.e. doves.)
Over the past 100 years, bad outcomes have occurred when we adopted dovish policies, and also when we adopted hawkish policies. Good outcomes have occurred when we adopted stable monetary policies.
The first thing is to “define” the concept of “stable monetary policies”. By that it is certainly not meant a stable rate of money supply growth. As Friedman wrote 50 years ago, “velocity can be whatever people want”, so by stable monetary policy I understand a “rate of money supply growth that appropriately offsets velocity changes so as to keep NGDP growing at a stable rate.”
An important addition is that the stable rate of NGDP growth should be pursued along a “chosen” level path. As I´ll show a “stable monetary policy” pursued along a “too low level path”, for example, has implications for the state (health) of the economy.
To get the idea of a “repeat of the 70s” out of the way, the charts below illustrate clearly that the inflationary decade was the outcome of an unstable monetary policy, i.e. one that allowed NGDP to have an upward trend. Other factors characterizing the decade, affecting the behavior of inflation, were the price/wage controls and oil shocks.

Now I show that over the past 3 decades, the Fed pursued “stable monetary policies” during two long periods. The two stable monetary policy periods were separated by the gross mismanagement of monetary policy that characterized the “Great Recession” (GR) and the second one ended with the outbreak of the pandemic.

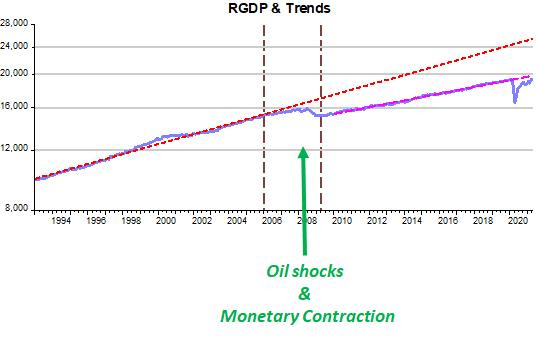
When you look at the Real GDP chart (RGDP) you can see that by pursuing a stable monetary policy along a lower level path, the economy came out of the GR but remained depressed relative to the previous path. If you assume, for illustrative purposes, that the Fed had managed to foster a complete recovery from the GR, the economy today would be 5+ trillion dollars “richer”.
Note also that during the initial phase of the 2004-08 oil shocks, NGDP growth remained on track. With that, RGDP growth was “lightly” affected by the shocks. The “tragedy” came with the massive monetary contraction in mid 2008.
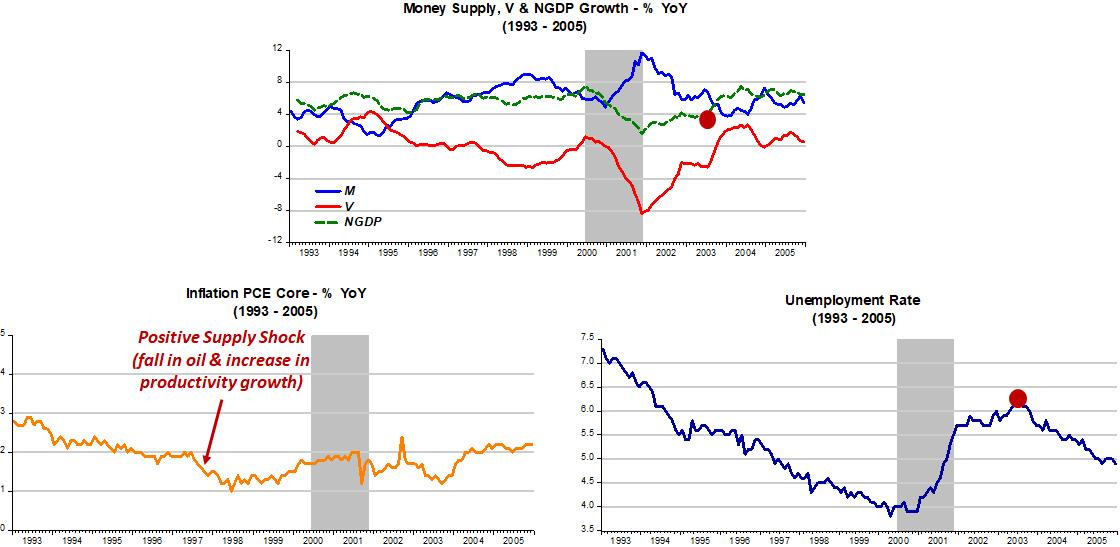
The 90s and first half of the 00s is an interesting period to analyze. Towards the end of the 90s there is a positive productivity shock. That lowers inflation, but monetary policy does not react to that (as “required” by an IT framework). It also shows the immediate consequence of even a “slight” loss of monetary stability (not fully offsetting velocity changes).
The shaded area shows how the consequent fall in NGDP growth leads to an immediate rise in unemployment. The red dot indicates that when monetary policy is geared to put NGDP back on the trend path, NGDP growth picks up and unemployment goes on a down trend.
The next panel illustrates Bernanke´s “march to the Great Recession”. I add a chart for the Fed Funds rate to indicate that interest rates give absolutely no indication of the stance of monetary policy (something that Friedman pointed to 50 years ago. See here for a discussion of the foundations for the arguments of this post).
To Bernanke, a rabid inflation targeter, the oil shocks that began in 2004 caused ripples in the core measure and abrupt increases in the headline measure. When headline inflation rose in 2007, monetary policy began to tighten more forcefully (despite the reduction in the FF rate). When headline reached 4%, monetary policy was tightened very aggressively.
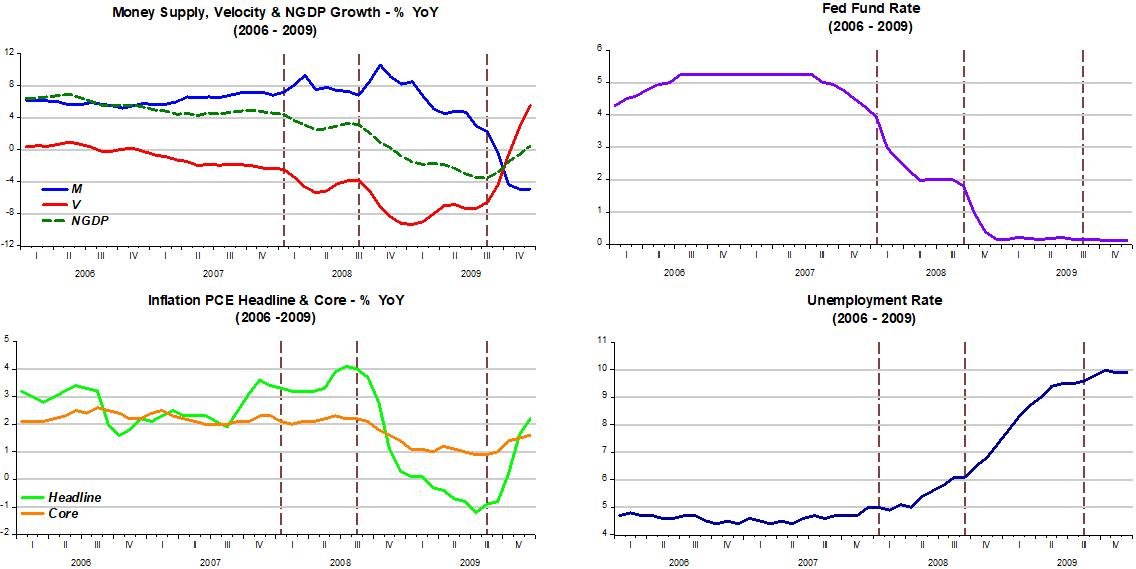
The panel above also throws doubt on the “long & variable lags” that are supposed to “complicate” the conduct of monetary policy. These lags refer to to interest rate movements, but I´ve shown that they do not give any indication about the stance of monetary policy. The fact is that variables like unemployment and inflation react “instantaneously” to changes in monetary policy.
Note, for example, that unemployment stops rising and inflation increases as soon as monetary policy becomes “accommodative” (with NGDP growth reversing direction).
The next panel shows the second period of monetary policy stability that extends from 2010 to 2019. Money supply growth closely offsets velocity changes in order to keep NGDP growing at a stable 4% rate. As I showed earlier, the Fed, maybe worried about inflation picking up, never orchestrated a full recovery from the GR, thus keeping the economy in a “stably depressed” state. Stable & low inflation and a continuous fall in unemployment were the outcomes.

The historically low level of unemployment reached without igniting inflation was a “surprise” to the Fed, accustomed to Phillips Curve thinking. This was the major factor leading the Fed to adapt its policy framework, moving from IT to FAIT (Flexible Average Inflation Targeting).
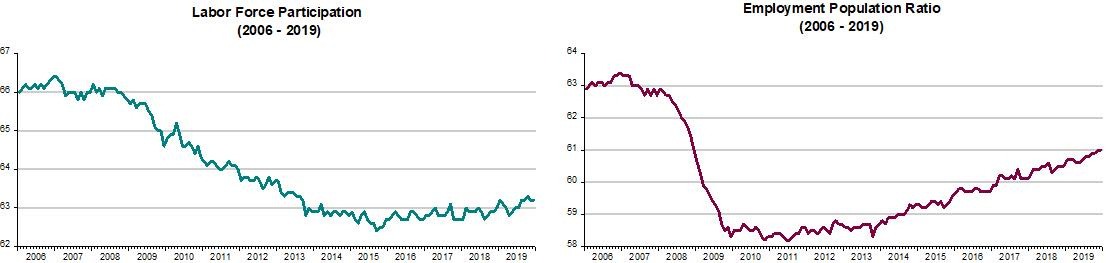
I don´t think that´s very useful (see here). The rate of unemployment is a very poor indicator of the state of the labor market. Although unemployment reached historically low levels, the fundamentals of the labor market, things like labor force participation and employment ratio, remained much depressed, just like the overall economy. It´s nothing like the pre GR economy. The charts illustrate.
And so we come to the “Pandemic”. The chart shows the brutal monetary tightening from the sudden and abrupt fall in velocity. Supply was also constrained, with Covid19 being both a demand and supply shock.
Since this time around the Fed was not the culprit, it reacted quickly to the surprise drop in velocity. The economic reaction was as expected. NGDP growth reversed, unemployment began to fall and inflation stopped falling.

For a long time we have heard from traditional monetarists (see here, for example) that the high rate of broad money supply growth that reached 30% YoY in mid-2020, spelled a steep rise in inflation. The chart above shows a very different story, indicating that the strong increase in money supply growth was just sufficient to offset the fall in velocity so as to keep NGDP growing at close to 0%!
Things changed after February 21, when velocity began to rise and money supply growth fell much less, increasing the rate of NGDP growth. As expected, inflation immediately picks up. Surprisingly, however, the unemployment rate does not move lower. This may be related to the stories about UI benefits that constrain labor supply.
To say more about the prospects for inflation, which are wholly dependent on the course of monetary policy, we have to look at the level charts below.
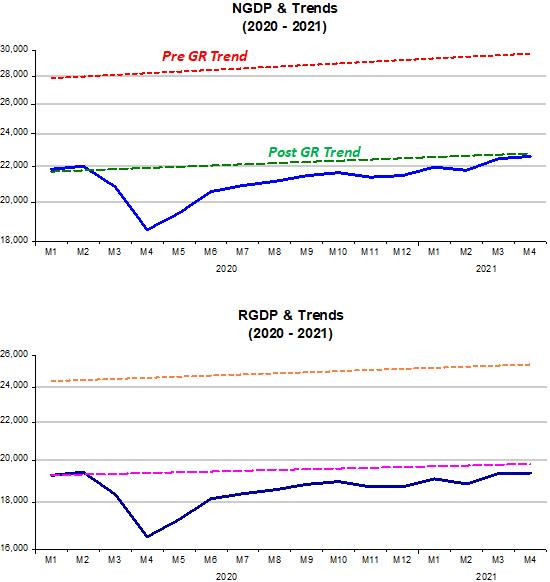
The high YoY growth of NGDP in April (21.7%) seen in the previous chart was just sufficient to take NGDP to the level that prevailed before the pandemic hit. The growth of RGDP (17.4%) was also significant, but was just enough to keep RGDP at the same level relative to the previous trend.
Given that RGDP didn´t close the gap, inflation made up the difference, indicating there are supply bottlenecks present.
The thing to note is that the more “certain” aggregate demand is set to increase, the quicker supply bottlenecks will be resolved, and inflation increases contained.
The Fed´s mission is to convince the “populace” that it wants to place NGDP on a level path somewhere between the present 22 trillion and the “ideal” 30 trillion dollars. The associated mission is to establish the “speed of approach” to the desired level path.
The more convincing the Fed is, the faster supply bottlenecks will dissolve and a faster “speed of approach” will be possible without pressuring inflation. Thereafter, a “cruising speed” on the 4%-5% range could be pursued for NGDP growth. Inflation would remain low and stable, unemployment would fall and the “quality” of the labor market greatly improved.
If, on the other hand, as the first part of Peter Boockvar´s quote indicates, the Fed is trying to find the level of “maximum employment” as the “guiding light” for monetary policy:
As for the Fed, if the only thing they are going to look at in driving monetary policy is the almost 8 million [workers] that are not back, they are not doing their homework.
An unstable monetary policy could be the outcome.
I believe, given the now long history of the Feds pursuit of monetary stability (even if “hidden” behind IT and now FAIT), that is a low probability risk.
If a stable monetary policy comes to pass, we will be left to enjoy Nick Rowe´s irony:
One big downside to NGDPLT is that we would miss all the interesting arguments about u* and Phillips Curves.
Note: The monthly GDP numbers are available at IHS Markit and the Divisia M4 broad money index at the Center for Financial Stability.
You don't define velocity. As Dr. Philip George posits: ““Changes in velocity have nothing to do with the speed at which money moves from hand to hand but are entirely the result of movements between demand deposits and other kinds of deposits.”
Thus a credit crunch will destroy velocity (where the banks outbid the nonbanks for loan funds).
Whereas the 1966 Interest Rate Adjustment Act created a .50% interest rate differential in favor of the Savings and Loan Associations (the thrifts, the nonbanks), the Emergency Economic Stabilization Act of 2008 provided a preferential interest rate differential in favor of the commercial banks, which induced nonbank disintermediation (where the size of the nonbanks shrank by $6.2 trillion dollars, while the banks were unaffected, increasing by $3.6 trillion dollars).
Funny, because the banks don't loan out existing deposits, or savings. Savings flowing through the nonbanks never leaves the payment's system.
The nonbanks were rolling over very short-term liabilities to fund longer term real-estate assets, thus their funding was abjectly and instantaneously, thereby removed. A huge monetary policy blunder.
Personal property price increases will cause retirees to lose their homes