I take the opportunity of this tweet by Alan Reynolds in the aftermath of yesterday´s increase in the Fed Funds rate, to present what I think is a more consistent view of the experience learnt during the 1980s.
A rare Fed soft landing happened after the Volcker hiked the funds rate by 100 bps twice in 1984. He did that apparently because real GDP had spurted 17.4% in six quarters. Why such astonishing growth?Because the reduction in tax rates enacted in 1981 was delayed - with all rates cut by 10% in Jan 1983 and another 10% in Jan 1984.
Dave Stockman and Alan Greenspan thought phasing tax rate reductions slowly was a good idea. Alan Reynolds and Art Laffer did not. In any case, Jim Baker persuaded Volcker to back off. So, what could easily have been Volcker's third inverted yield curve hard landing was avoided. https://cato.org/blog/tax-reform-error-2-phasing-lower-tax-rates
And continues:
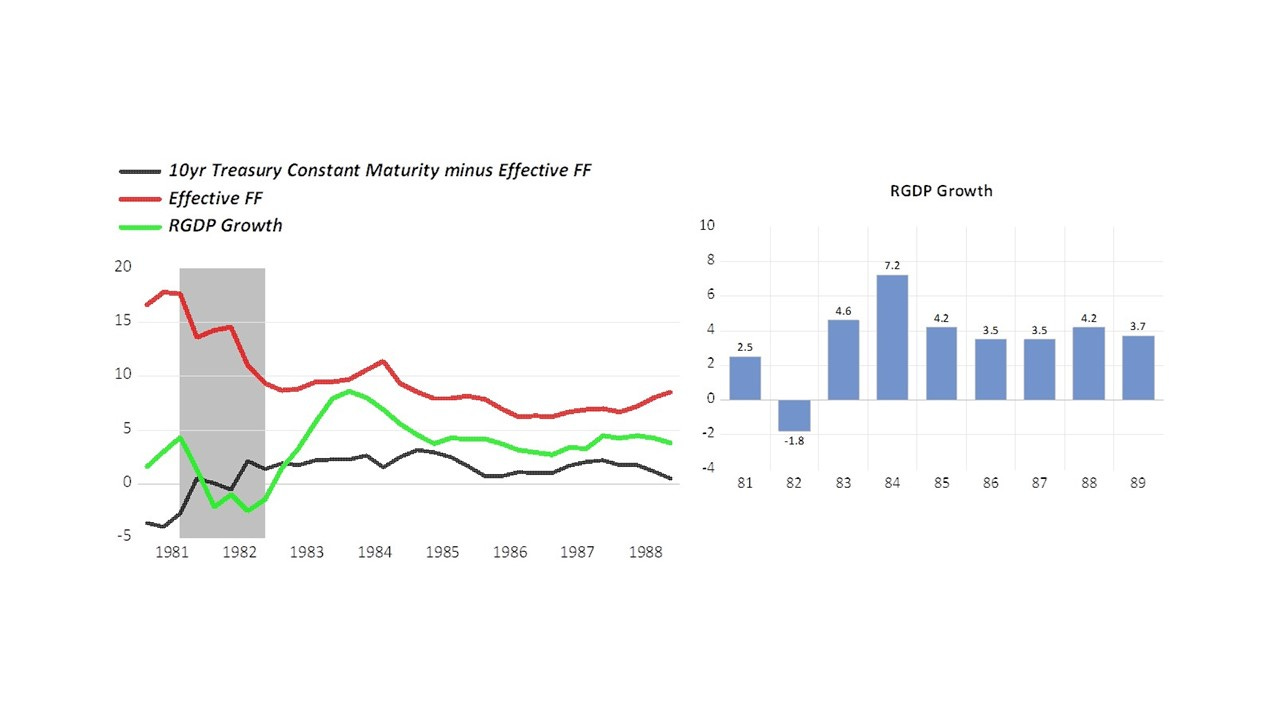
The graph on the left shows the 1981-84 war between Volcker interest rates 1981-82 [the red line] and two Reagan tax rate reductions of 10% in January 1983 and again in January 1984 [the green line]. The Volcker Fed's inverted yield curve [the black line] won the first round in 1982. The graph on the right shows that President Reagan's team won the rematch in 1984-89. https://cato.org/blog/reagan-volcker-years-retrospect-3
“The economy is going a little bananas,'' says Jerry Jasinowski, chief economist and executive vice-president of the National Association of Manufacturers.
''What is going on now smacks of a boom. There is no other way to describe the very broad-based strength of the economy,'' adds Allen Sinai, chief economist at Shearson Lehman/American Express.
Meanwhile, inflation, as calculated by a GNP-related measure called the implicit price deflator, ran at a 3.2 percent rate in the second quarter of 1984 , down from the 4.4 percent rate posted in the first three months of 1984
''I don't know how you could write a script for a better recovery than you have right now,'' Secretary Baldrige told reporters.
The latest report on the economy appears to be good news for President Reagan , who is seeking reelection at least partly on the basis of his management of the economy.
But, as always. the “Phillips Curve crowd” is skeptical:
But some economists warn that the fast growth is bringing the economy closer to full use of its productive capacity. In general, the closer an economy gets to full use of its factories and labor force, the greater the upward pressure on prices.
''Seven-and-a-half percent growth in the sixth quarter of a recovery means you are growing twice as fast as your capacity to produce'' is expanding, says Donald Ratajczak, director of the Economic Forecasting Project at Georgia State University. ''We are speeding toward a wall and getting close to it. If we don't slow down, we'll get an inflationary crash.''
And then, the (wrong) concluding comment:
Among the key reasons for strong economic growth are the 1981 tax cuts and the ''enormously stimulative'' federal budget deficit, says Robert Gough, an economist with Data Resources Inc., a forecasting firm.
To Alan, the trouble with phasing‐in lower tax rates is that it creates an incentive to postpone efforts and investments until later, when tax rates will be lower, which explains why the the recovery picked-up only after the lower tax rate “phased-in” in January 1983.
Thanks for reading Money Fetish! Subscribe for free to receive new posts and support my work.
My story
I believe the start date is December 20, 1982 when, for two days the FOMC held its meeting. There was a long discussion of NGDP Targeting. Some snippets:
(page 20) MR. MORRIS.I think we need a proxy–an independent intermediate target– for nominal GNP, or the closest thing we can come to as a proxy for nominal GNP, because that’s what the name of the game is supposed to be.
I think the [monetary targets] targets have misled us this year. That is, up until October when we finally caught up with it, it seems to me that the monetary aggregates misled this Committee into following a much more restrictive policy than we intended. And that is reflected in a nominal GNP growth this year, which we’re now estimating at 3.6 percent, that I don’t think any of us a year ago would have [favored] as a target for nominal GNP.
We need a proxy for nominal GNP, but we certainly don’t want to go back to interest rate targeting.
(page 40) VOLCKER. I do think we’re going to be forced into a more explicit rationale, whatever we do, in terms of the nominal GNP. I’m not saying we have to target nominal GNP very directly, and there are obviously dangers in that, but I do suspect that we’re going to be drawn out on that subject much more heavily than we have been in the past. I think there is a real danger in that because it does overemphasize what we in practice can do. I think there’s great overemphasis now on what monetary policy can do either in terms of nominal GNP or interest rates. And it’s very dangerous.
What are those dangers exactly? Volcker´s remark "that there is great overemphasis on what monetary policy can do." indicates that nominal GDP targeting would create too much accountability for the Fed!
18 years later, in 2000, there was a conference in the Boston Fed in honor of Frank Morris (Boston Fed president for 20 years (1968-88)). In his presentation “The role of interest rates in Federal Reserve policymaking”, Benjamin Friedman “forgets” to honor him, instead giving him the “cold shoulder “, ,writing:
The object of this paper is to look back, and ahead as well, at one of the most central aspects of this ongoing discussion of monetary policy: the proper role of interest rates. When Frank Morris first joined the Federal Open Market Committee, the Federal Reserve, like most central banks at that time, made monetary policy by setting interest rates. The same is once again true today. In retrospect, much of the intervening experience proved to be a historical detour.
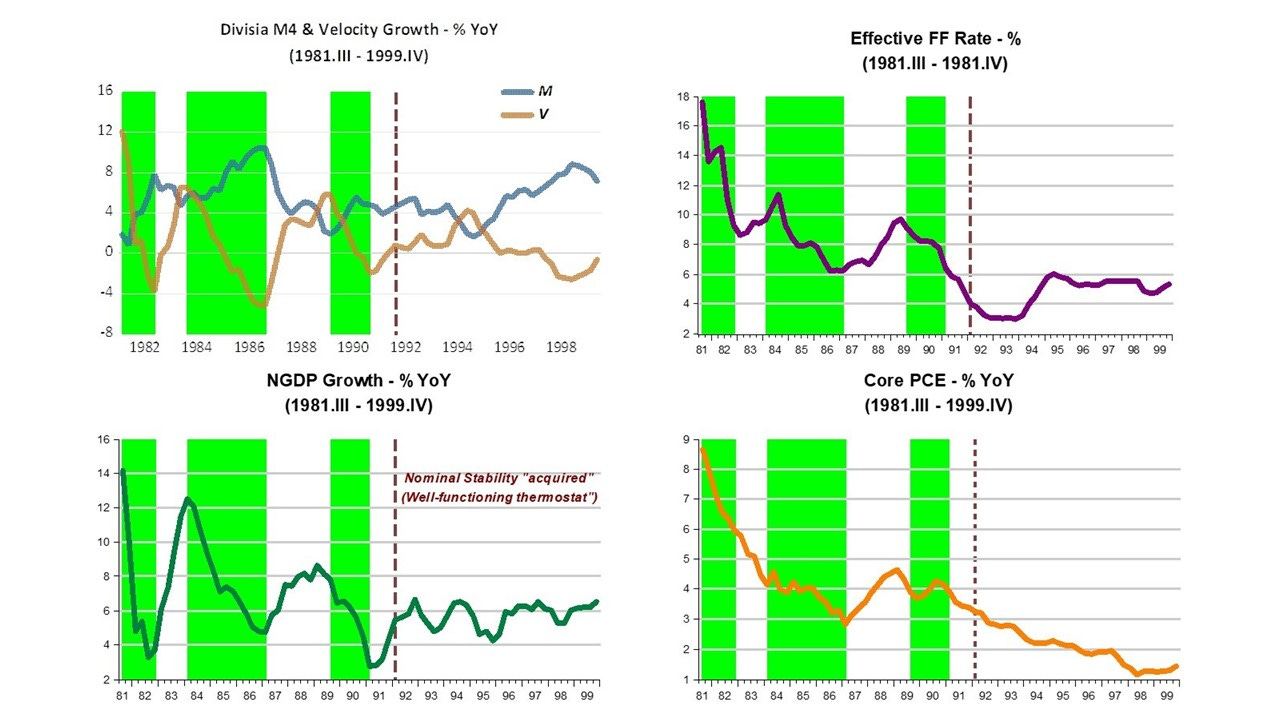
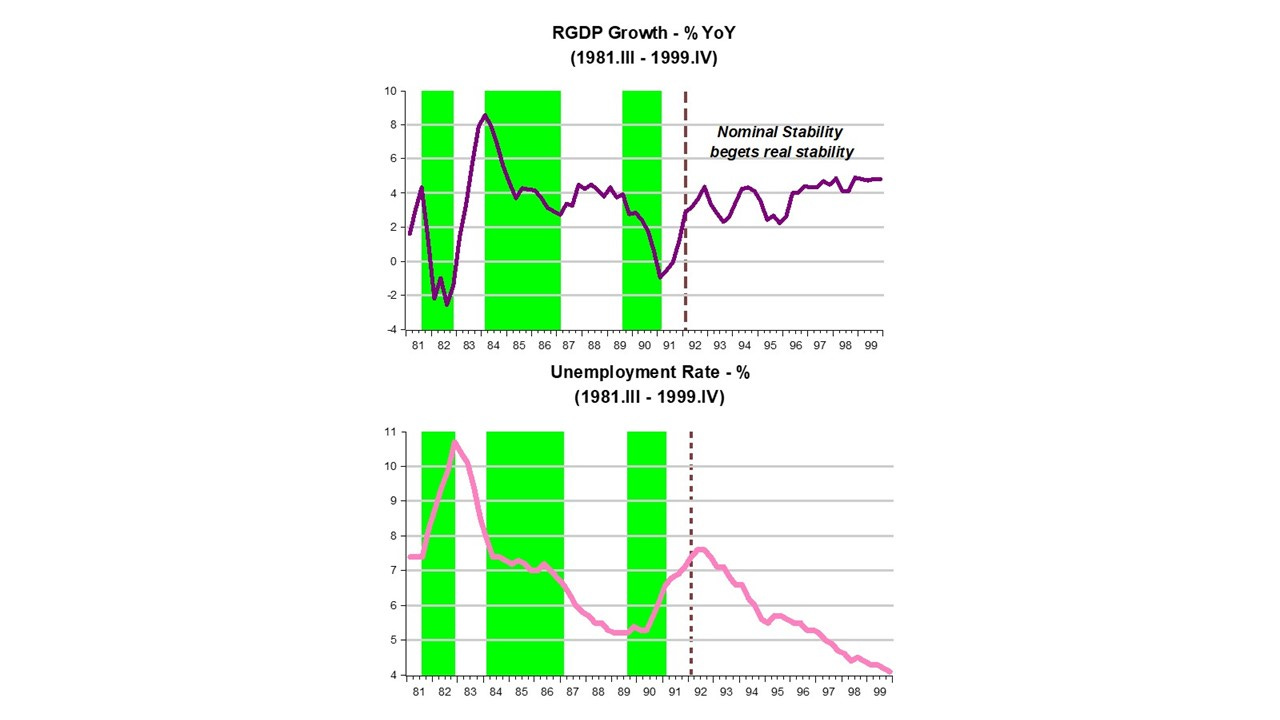
The panel below illustrates what I mean by “learning experience”. Looking first at the NGDP growth chart, you notice that, throughout the 1980s, the swings in NGDP growth become smaller. Looking at the money & velocity growth chart, you notice that the Fed gets more proficient in “setting the thermostat” so as to offset changes in velocity in order to keep NGDP growth on a stable growth path.
By the early 1990s the Fed became quite adept at it, with the result that Nominal Stability was attained.
Throughout, the FF rate was on a downward trend, with some intermittent upswings. Does that mean monetary policy was mostly easing? In the first green bar, for example, despite the drop in interest rate, NGDP growth tanks, dropping to less than 4% from 14%! That´s very tight monetary policy, where the growth in money supply did not get close to offsetting the fall in velocity.
Why was the recovery in real growth so robust following the 1981-82 recession, something that made the Phillips Curve crowd so “ anxious”? Despite the increase in the FF rate during that period, monetary policy was significantly expansionary, with NGDP growth climbing from less than 4% to 12%. This reflected the fact that the rise in velocity was not at all offset by a fall in money supply growth, which remained stable.
Interestingly, Milton Friedman´s prognosis made on September 26 1983 in his Newsweek column “A case of bad good news” reads:
President Reagan, politicians of all political persuasions, journalists specializing in economics, Wall Street, the business community—all these and many more are hailing the recent economic statistics showing rapid growth in output and employment as very good news indeed.
One group of economists—the monetarists—are a conspicuous exception. In early 1983, almost to a person economic forecasters were predicting a slow and sluggish recovery. We predicted that “1983 will be a year of rapid and vigorous economic growth.”
That judgment was based on two considerations: the length and severity of the recession that ended in December 1982 [Friedman´s “Plucking Model”], and the monetary explosion that was then in process—a rise in M1 at the annual rate of 15 percent from July 1982 to January 1983.
It seemed to us that “this monetary explosion assures vigorous economic growth in the coming months”—but also that “unfortunately, if it continues much longer,it will also produce a renewed acceleration of inflation and a sharp rise in interest rates.”
The monetary explosion did produce vigorous growth. Unfortunately, it also did continue—at the annual rate of more than 14 percent from January to July. Interest rates have already risen sharply. Inflation has not yet accelerated. That will come next year, since it generally takes about two years for monetary acceleration to work its way through to inflation.
…The monetary explosion from July 1982 to July 1983 leaves no satisfactory way out of our present situation. The Fed’s stepping on the brakes will appear to have no immediate effect. Rapid recovery will continue under the impetus of earlier monetary growth.
With its historical shortsightedness, the Fed will be tempted to step still harder on the brake—just as the failure of rapid monetary growth in late 1982 to generate immediate recovery led it to keep its collective foot on the accelerator much too long. The result is bound to be renewed stagflation—recession accompanied by rising inflation and high interest rates.
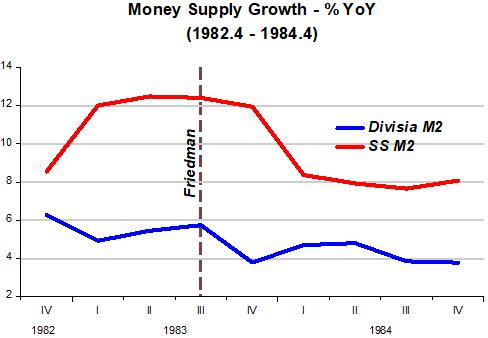
As the charts above show, nothing of the sort happend! Interestingly, on the same date, William A. Barnett (the economist behind the development of Divisia monetary indices) gave an interview to Forbes, which was titled “What explosion”?
…The other conclusion is that people have been panicking unnecessarily about money supply growth this year. The new bank money funds and the super NOW accounts have been sucking money that was formerly held in other forms…But Divisia aggregates are rising not much different from last year. Thus, the apparent “explosion” can be viewed as a statistical blip.
The chart below shows the drastically different information given out by the two aggregates (Divisia M2 & Simple Sum M2).
Bringing the 1980s experience to the present
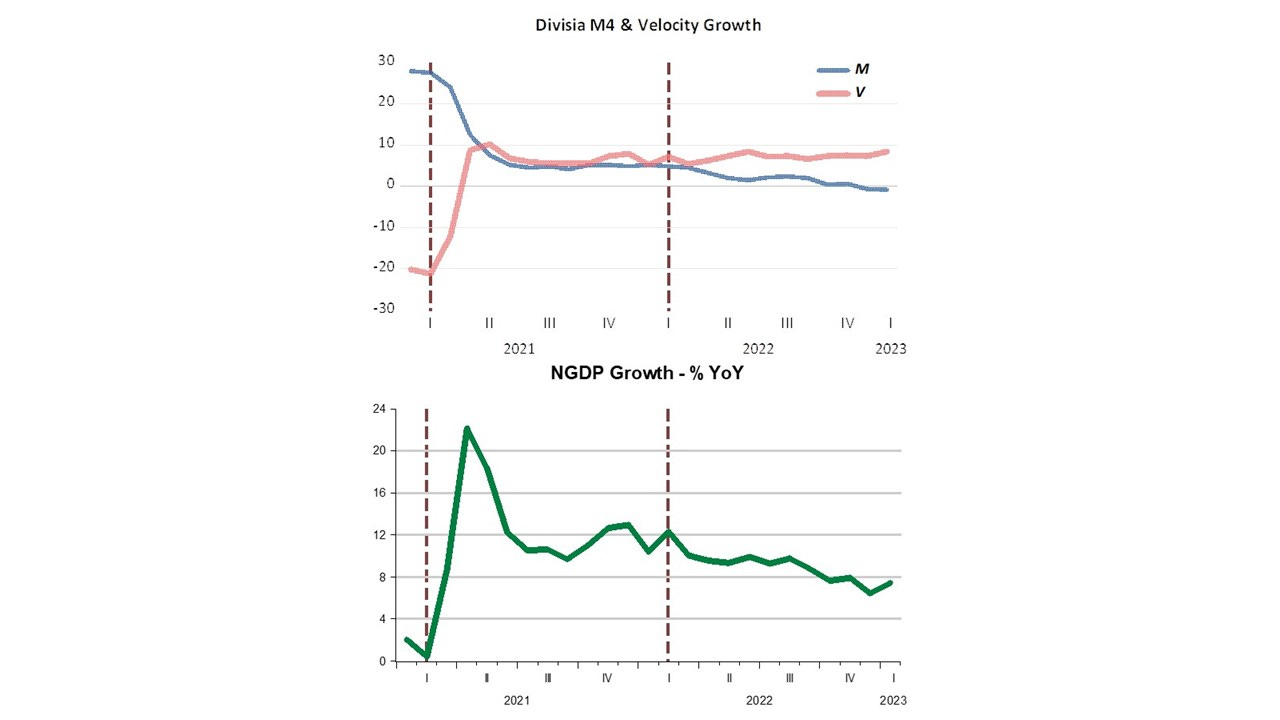
The chart below indicates that in early 2021, monetary policy failed wildly to offset the rise in velocity. The result was a “majestic” increase in NGDP growth, that together with supply restrictions from C-19, resulted i a strong rise in inflation.
Since early 2022, the Fed is getting its act back together. The stable increase in velocity growth has been accompanied by a (so far) gentle decrease in money supply growth, which has now turned (as required) negative. NGDP growth (and inflation) has followed suit.
There´s still much work ahead. Unfortunately, the “high concentration” on interest rate targeting, doesn´t help. The recent financial woes, in large part due to the rapid rise in rates, may affect velocity, with implications for the required behavior of money supply.
How monetary policy (not to be confused with interest rate policy) acts going forward will determine the outcomes for growth, inflation and unemployment. Here, the lessons of the 1980s are very relevant!
Thanks for reading Money Fetish! Subscribe for free to receive new posts and support my work.
All monetary savings originate within the payment's system. All bank-held savings are lost to both consumption and investment – i.e., until their owners, e.g., invest them directly or indirectly via non-bank conduits. And activating monetary savings outside of the banks does not reduce the size of the payment's system.
Secular stagnation is the deceleration in the transactions' velocity of funds because of the impoundment of savings in the commercial banking system.
A credit crunch occurs when there is an outflow of funds or negative cash flow.
The last period of disintermediation for the commercial banks, prior to the monetary policy blunders during the Great Recession, occurred during the Great Depression, which had its most force in March 1933.
Ever since 1933, the Federal Reserve has had the capacity to take unified action, through its “open market power”, to prevent any outflow of currency from the payment’s system. That’s what the discount window is for.
BAGEHOT’S DICTUM: the central banks should lend early and ‘without limits’ to solvent firms at a ‘higher interest rate’ with ‘good collateral’. But discounting was made a penalty rate on January 6, 2003
But Volcker did the opposite where discounting was not contractionary.
And: “In 2002, the Federal Reserve began to set the discount rate above the federal funds rate, reversing its previous practice of keeping the discount rate below the funds rate.”
Bank credit contraction is cumulative and reinforcing. Contraction is usually volatile and disorderly.