
Last month the “caption” was:
In “The US Economy has an Inflation Problem”, Desmond Lachman writes:
If there is one thing that we know about monetary policy, it is that it operates with long and variable lags. This makes today’s Fed inflation denial all the more regrettable. By the time the Fed gets around to dialing back its currently ultra-easy monetary policy stance, the inflation genie is all too likely to be well out of the bottle.
This month I underline a comment from Steve Hanke at the WSJ on July 28:
Fed Chairman Jerome Powell conceded at his press conference Wednesday that prices had caught the central bank by surprise, but he showed no particular concern. The Federal Open Market Committee’s statement Wednesday after its two-day meeting also showed little interest in reeling in what has been the most reckless monetary policy since Arthur Burns roamed the Eccles Building. History hasn’t been kind to Burns.
But is monetary policy reckless?
I start, as always, with the “Thermostat” chart. To simplify, the “thermostat” is the Fed (money supply growth), that works to keep the “inside temperature” (NGDP growth) stable by offsetting changes in the “outside temperature” (velocity).
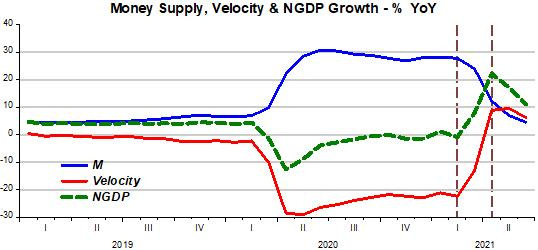
Note that, between the two vertical bars, the rise in velocity is larger than the fall in money supply, so that NGDP growth increases. To the right of the second bar, the fall in the money supply growth is bigger than the change in velocity growth, resulting in a drop in NGDP growth.
When Steve Hanke accuses the Fed of pursuing a “reckless” monetary policy, he is looking, as a “one-legged monetarist”, only at the growth of the supply of money, forgetting what´s happening to money demand (the inverse of velocity). If the Fed had kept the growth of money supply unchanged, or growing much less rapidly than it did, the economy would have dived into a depression!
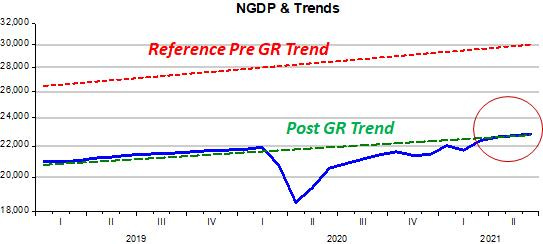
To what level of “warmth” has the recent “heating up” of aggregate nominal spending taken the economy? From the levels charts, we see that in terms of aggregate nominal spending (NGDP), the economy got back back to the trend level path that prevailed post GR a few months ago, remaining at that trend level path since as indicated by the red circle.
However, “real warmth” still remains stuck below post GR level path (and far below the pre GR path).
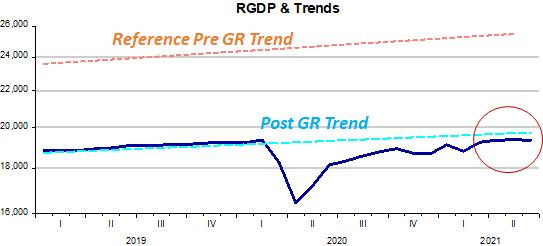
The fact that RGDP remains stuck below the previous trend path while NGDP is back on trend, is likely due to supply bottlenecks, and this difference is reflected in higher inflation, as illustrated below.
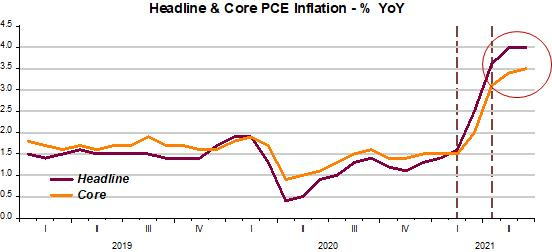
Note the rise in inflation when NGDP growth increases and the tapering off of inflation when NGDP growth recoils. Importantly, with money supply growth falling fast (for July I anticipate money growth below 2% YoY, following a 4.5% rise in June), and velocity not changing much, it is unrealistic to believe inflation will rise to levels such as 7% or more over the next several months as some prognosticate .
Will the Fed choose to place the economy on a path above the post GR path? Maybe it´s waiting for supply bottlenecks to be resolved before it does so, avoiding undesirable inflation pressures.
Anyway, the Fed is still short of its new FAIT framework. Over the past two years, average headline PCE inflation was 1.7% (1.9% over last 30 years), while Core PCE inflation was 1.8% both over the past two and 30 years.