For several weeks now, inflation has been the “talk of the town”. That may be justified given the fact that for decades inflation has been the “missing element in public discourse”.
“Proof” of assertion:
Suddenly, going to #CPI Day is like going to the circus! Not least because of all the clowns opining about #inflation. For me, it's just one more day as the Inflation Guy; it's just that I have more company now since it seems EVERYBODY is an inflation guy all of a sudden.
Unfortunately, the focus has been on “all over the place” price categories, when the concept of inflation is a little more nuanced. After three decades of subdued and mostly below target inflation, what happened?
As usual, I tell a “visual tale”. The backdrop is the equation of exchange in growth form, m+v=p+y, where m=money supply growth, v=change in velocity, p=inflation and y=the growth of real output, with (p+y) being the growth of aggregate nominal spending, or NGDP. That identity is made into the Quantity Theory of Money (QTM) by making some assumptions. Usually those are that velocity is stable and that in the long run, y (the growth of real output (RGDP)) is given (determined by real factors such as the growth of population and productivity).
Since at business cycle frequencies, v is not stable (as Friedman put it more than 50 years ago, it can be whatever people want) and RGDP growth (y) can change quite suddenly also, I prefer to look at the equation of exchange as analogue to a thermostat.
A well functioning thermostat will work so as to offset changes in the outside temperature so as to keep the inside temperature stable. If we think of monetary policy (which determines m) as the thermostat, v as the “outside temperature” and (p+y=NGDP growth) as the “inside temperature” a “good” monetary policy will strive to offset changes in velocity in order to keep NGDP growth on a stable path.
If monetary policy is “bad”, the thermostat will be functioning badly, either by imparting a rising (or falling) “inside temperature” (NGDP) trend or by making the “inside temperature” excessively volatile.
Before I tackle the more complex situation brought about by the pandemic, the charts below provide examples of a “well functioning thermostat”, the period following the Great Recession to before the pandemic hit, and of when the “thermostat failed to work properly” going into the Great Recession.
There are both nominal and real consequences from the workings of the thermostat. So as not to burden the readers with too many pictures, leaving those for the analysis of the pandemic period, suffice to say that for the “well functioning thermostat” period, inflation and RGDP growth remained stable, and unemployment was on a downward trend, while for the period the “thermostat worked badly”, inflation and RGDP growth fell and unemployment was on a steeply rising trend.
The Pandemic Period
Sometime in February 2020, the pandemic hit full force. Reactions were immediate. Those comprised, simultaneously, a supply AND demand shock. The demand shock (a shock to velocity) was considerably stronger to start with. Real output tanked and some measures of inflation dropped significantly (the hallmarks of a demand shock).
Nevertheless, it was a deep, but very short (the shortest in US history) recession, lasting all of two months. Why? To find the answer, we only have to look at monetary policy, as reflected in the behavior of aggregate nominal spending (NGDP) growth.
The charts below illustrate, with “markers” along the way to make visualization easier. In the first pair of charts we observe the quick reaction of monetary policy that quickly increased the broad money supply, Divisia M4 (To understand the importance of properly measured monetary statistics, see here) to offset the steep drop in velocity.
Just imagine if money supply growth had not increased as much as it did, as “old school” monetarists were loudly complaining about in Spring 2020. A depression would have been a likely outcome.
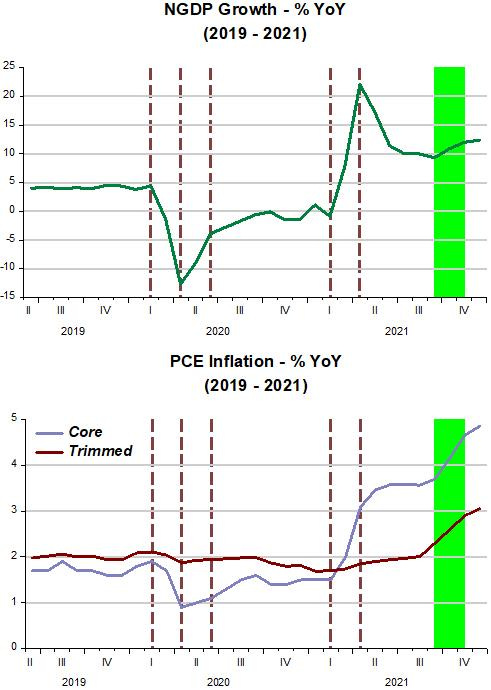
The second pair of charts show two important nominal consequences, NGDP growth quickly picked up and the measure of inflation that had fallen began the journey back.
One thing appears quite evident, to wit: there are no “long and variable lags” to arrive at the effects from monetary policy adjustments. In fact, effects show up quite quickly! (and throughout, the policy rate was stuck at “zero”)
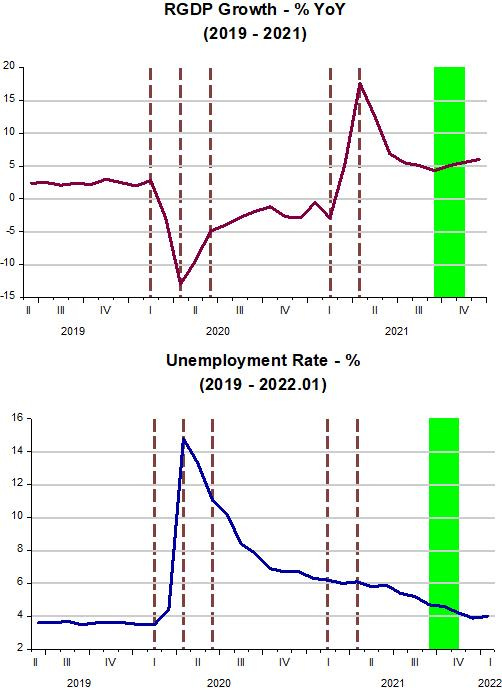
The next pair of charts show the “benefits” from an appropriate monetary policy that accrues to real variables such as RGDP growth and unemployment.
From the inflation chart above, we see that inflation only became a “problem” after April 2021, when the Core PCE went above the 2% target. That´s when aggregate nominal spending first hit the “supply-chain walls” (for more details on that, see this Joey Politano post here).
As the charts below indicate, this time showing the level chart for NGDP, when monetary policy was sufficiently expansionary (less than offsetting the steep rise in velocity), NGDP growth jumped, taking the level of NGDP back to the pre pandemic (post Great Recession) trend.
The Fed was quite correct to do that, since it cannot do anything about supply shocks, acting so as to keep NGDP on a stable trend path.
Measures of inflation more closely related do Covid19 (or “supply chain” constrained) increased, but flattened out quickly, with NGDP remaining “on trend”. As soon as NGDP climbs above trend, all measures of inflation increase, indicating the point when monetary policy became “excessively” expansionary.
Note, however, that more recently NGDP levelled-off, and soon we observe a kink in the inflation lines. What are the scenarios going forward?
I find the recent “debate” on the number of times, the level and how quickly the Fed will “get interest rates there”, not very useful (except, maybe, to volatility traders).
There are those like Mohamed A. El-Erian @elerianm, who tweets about inflation umpteen times every day:·
The @FederalReserve's dilemma is tricky given how badly it has eroded its #inflation-related reputation and lost control of the policy narrative:
Act aggressively to regain credibility at the risk of derailing the recovery; or
Go slow and risk playing catchup continuously?
Others, like Mike Sandifer have a more measured take:
Fortunately, the Fed, under the current FOMC, seems to be the best informed, most competent Fed ever. They should be lauded for their relatively brilliant performance during the pandemic recession and its aftermath. There is a better chance that they’ll avoid causing a recession than past Feds, but that chance certainly isn’t 100%.
It is debatable whether the Fed slightly overstimulated the economy. Given that the 5 year breakeven inflation rate never even reached 3% in PCE terms during this recovery, I see no reason for much concern about inflation from a monetary policy perspective. The relatively high current inflation rate is due to shortages and demand surges related to the pandemic, rather than monetary policy, hence the implicit market expectation that the inflation is indeed “transitory”.
And then there are those, like Andrew Levin´s presentation before the SOMC (Shadow Open Market Committee), who get it exactly wrong:
Basic Principles of Monetary Economics
§ The stance of monetary policy is gauged by the nominal interest rate minus inflation, which is universally referred to as the real interest rate.
§ The extent of tightness or accommodation is gauged relative to the equilibrium real interest rate (r*).
The stance of policy is certainly not gauged by interest rates (nominal (observed) or “real” (very imprecisely measured)). And no one knows, to any reasonable approximation, what the equilibrium (or “natural”) rate is!
The charts below describe 3 scenarios that have a direct implication for inflation. they are described by both the level of NGDP for the next several months and the associated NGDP growth.
The “SF” scenario stands for the “rising streets” of San Francisco. That scenario would have a very short “shelf life” and would quickly turn into the “A” scenario, which stands for downhill skiing the slopes of Aspen.
Those are very bad outcomes, and would show that the Fed has put “foot in mouth” (but El-Erian thinks that is quite possible!).
The best (maybe most likely scenario) is for the Fed to drive on “IH-70 through Kansas). By keeping NGDP stable close to the present level (with velocity likely rising with the pandemic waning, it will have to decrease money supply growth (that might even have to turn negative. At that point the “old monetarists” will decry a coming deep recession”)).
Under “KS”, NGDP growth will come down and so will inflation, more or less quickly depending on how fast “supply-chain” and other supply constraints are resolved. It is likely that we would see the trimmed measure falling faster, given it is less “Covid19 constrained”.
If you reached this far and found it useful, or maybe interesting, why not subscribe and share with friends?


