
Money: It´s about Supply AND Demand
Money: It´s about Supply AND Demand
But it is mostly supply that shows up on the stage

To those that still consider money important, we mostly read and hear about Money Supply. Almost never there is mention of Money Demand (or its inverse, Velocity).
Martin Feldstein is a “high visibility” name that “switches hats” all the time in his predictions of inflation, and never seems to get it right!
Martin Feldstein (June 2009). Just as the Great Recession was coming to a (later announced) close, Feldstein presents himself as a “Phillips Curver” in the short run and a “Monetarist” in the long run:
The simplest explanation for the higher 10-year rate is that many investors now expect inflation to rise. Although economic weakness and excess capacity are keeping current inflation low, the explosive rise of bank reserves created by Fed policy provides fuel for future inflation. The prospective decline of the dollar is also a potential source of inflation.
One year later, in June 2010, Martin Feldstein´s tune changes, reverting to his “Phillips Curve self”:
The investors that I talk to these days are not sure whether to worry more about future inflation in the United States or about future deflation. The good news is that the answer for at least the next few years is that investors should worry about "neither."
America´s high rate of unemployment and the low rates of capacity utilization imply that there is little upward pressure on wages and prices in the US. And the recent rise in the value of the dollar relative to the euro and the British pound helps by reducing import costs.
Five years later, in May 2015, Martin Feldstein puts on his “monetarist hat” back on:
The low rate of inflation in the United States is a puzzle, especially to economists who focus on the relationship between inflation and changes in the monetary base. After all, in the past, increases and decreases in the growth rate of the monetary base (currency in circulation plus commercial banks’ reserves held at the central bank) produced – or at least were accompanied by – rises and falls in the inflation rate. And, because the monetary base is controlled directly by the central bank, and is not created by commercial banks, many believe that it is the best measure of the impact of monetary policy.
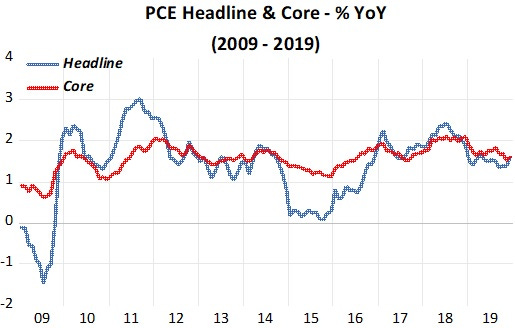
What did transpire during the period in which Feldstein was raming his views of inflation down our throats and in the years that followed? The charts show that his predictions never came to pass.
Then there is Steve Hanke, an “inflation specialist” that even has a an international Inflation Dashboard. He´s a firm believer in Money. He´s also concerned about measuring money correctly. In 2018, he wrote “On measuring the money supply”, a nice primer on Divisia Monetary Indices pioneered by William A Barnett:
When Paul Volcker took the reins at the Fed, the state of the U.S. economy’s health was “bad.” Indeed, 1979 ended with a double-digit inflation rate of 13.3%. Remember stagflation?
Chairman Volcker realized that money matters, and it didn’t take him long to make his move. On Saturday, October 6, 1979, he stunned the world with an unanticipated announcement. He proclaimed that he was going to put measures of the money supply on the Fed’s dashboard. For him, it was obvious that, to restore the U.S. economy to good health, inflation would have to be wrung out. And, to kill inflation, the money supply would have to be controlled.
Volcker achieved his goal. By 1982, the annual inflation rate dropped to 3.8%—a great accomplishment. But, the problem was that the Volcker inflation squeeze brought with it a relatively short recession (less than a year) that started in January 1980, and another, more severe slump that began shortly thereafter and ended in November 1982.
Paul Volcker’s problem was that the monetary altimeter installed on his dashboard was defective. When my friend Volcker looked at his M2 gauge, he was viewing M2 data that were calculated by a simple summation of their components—the normal Fed procedure.
As shown in the chart below, the Fed thought that double-digit fed funds rates that it was engineering allowed it to tap on the money-supply brakes with just the right amount of pressure. In fact, if the money supply had been measured correctly by a Divisia metric, Volcker would have realized that the Fed was not just tapping on the breaks, but unnecessarily slamming on them from 1978 until early 1982. The Fed was imposing a monetary policy that was much tighter than it thought—an excessive tightness that resulted in two recessions (shaded areas).

The Divisia Monetary Indices are “housed” at the Center for Financial Stability, where Hanke serves as a Special Counselor. It´s curious that despite that association, in his op-eds, comments and interviews, Hanke only mentions (Simple Sum) M2!
In mid-2020, following the C-19 “attack”, Hanke saw the jump in M2 growth and “previewed” a strong increase in inflation. Now, given that M2 growth has gone into negative territory, he´s anticipating a “Whopper of a recession”.
At the start and towards the end of the period, the behavior of SSM2 and Divisia M4 is similar. The larger differences are in between. Contrary to what was happening in the late 1970s-early 1980s, Hanke could have been talking about the Divisia measure!

Before commenting, it is useful to put up the chart for the Fed Funds rate, the “measuring rod” that is conventionally used to depicts the stance of monetary policy.

What do we observe? When C-19 hit, money supply growth quickly rose “astronomically”. The Fed reduced the Funds rate “all the way”. Inflation, nevertheless dropped significantly. By April of 2020, when the recession ended, according to the “money supply growthers” we should “Get ready for the retun of inflation” - With Fed actions having increased the quantity of money in the U.S. economy at a blistering rate.
With money growth increasing at a “blistering rate” and interest rates dropping to “nothing”, how come inflation fell? It must be that despite all the “monetary easing” that took place in those two months, monetary policy was still “too tight” (evidence for this later)!
After April 2020, money supply growth went on rising and the FF rate remained “prostate”. Inflation, however, only gradually increased over the next twelve months back to its original level, which happened to be a little short of the 2% target.
At that point - March 2021 - inflation rises above target and keeps going up. At the same time, money supply growth turns down and interest rates remain at “zero”. As people like Hanke and Congdon had warned in Spring 2020, the inflation increase had finally arrived,”delayed”, as it were, by the “lags in effect of monetary policy”!
Again, about a year after money growth began to fall, inflation peaked and has been gradually falling since. The peak in inflation coincided with the first move up in the FF rate, which took place in March 2022. Maybe that´s why many feel that the Fed was one year late to begin “tightening” monetary policy.
To the likes of Hanke and Congdon, money growth has now fallen so low, even turning negative more recently, that they now predict a (maybe) deep recession is unavoidable in the near future. The Fed, on the other hand, thinks it still has to increase interest rates and keep them “high” for some time going forward.
In short, we´re in the midst of an “analytical mess”. That must be true because last June the Fed boss himself said “I think we now understand better how little we understand about inflation”.
One consequence of the “analytical mess” that prevails is the fall in the “quality” of the economic discussion, in particular, the “debate” about inflation. Maybe to better “understand” inflation, inflation is being “broken down” into its “component parts”.
In addition to the consideration of “headline” and “core” measures , we now have additional beakdowns like “super core” and “super duper core” inflation. Even the Fed has a breakdown preference (that many disagree with because it shows inflation is “higher” than their preferred breakdown, which will likely lead to bad monetary policy!). Vocal participants in the “inflation breakdown war” with the Fed are Alan Reynolds (@AlanReynoldsEcn on Twitter) and James E Thorne (@DrJStrategy).
I believe that the “analytical mess” that prevails and the attendent consequences, is the direct result of concentrating attention on the money supply without a scintilla of concern to money demand. I also believe that the almost exclusive focus on interest rates is of very little (if any) help in untangling the “mess”.
In a monetary economy, aggregate demand will only fall (bringing down prices or inflation) if there is an excess demand for money. In short, aggregate demand or spending shortfalls can only happen in a monetary economy if “everyone” is trying, simultaneously, to stock up on broadly defined money (as measured by Divisia M4, for example).
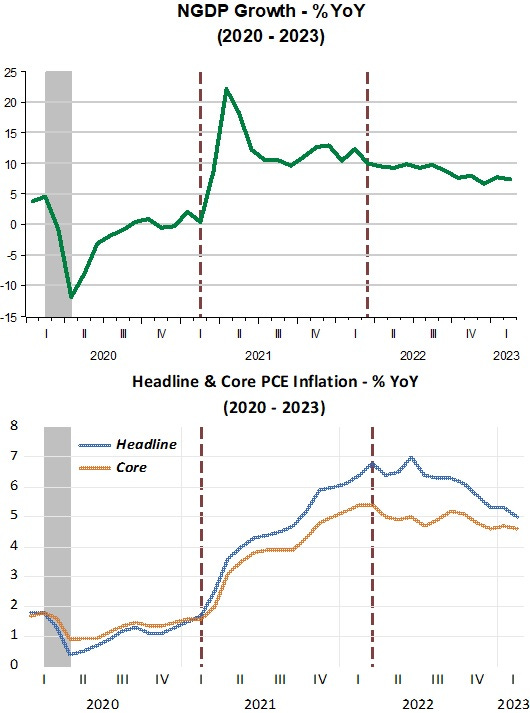
In a growing economy operating under Nominal Stability, a spending shortfall will happen if aggregate spending (or NGDP) falls below its trend growth level path. The chart below illustrates.

Since the end of the Great Recession in 2009, NGDP was rising along the path defined by the dotted line. When C-19 hit, NGDP quickly dropped way below the path. As we saw above, inflation fell despite the jump in money supply growth and the FF rate falling to “nothing”.
By early 2021, NGDP was back on its previous trend level path (and inflation was back to the level that prevailed before the spending shortfall). At that point, the excess demand for money had been “erased”.
Aggregate spending, however, continued to increase. So we went from a situation of excess demand for money to one of excess supply of money. Just as an excess demand for money will result in spending shortfalls (and subsiding inflation), an excess supply of money will result in an excess demand for all other goods, putting pressure on inflation (even more so if there are supply constraints present)!
The next chart “contrasts” money supply with money demand (in fact with its inverse, Velocity).
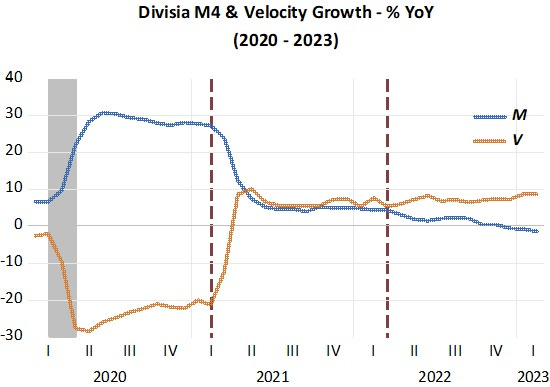
You clearly see why inflation fell when C-19 hit. Velocity fell by more and more quickly the money supply growth increased! One year later, velocity rose by more than money supply fell, explaining the rise in inflation.
In all, the “timing” for the moves in aggregate spending and inflation is perfect! No “loose ends” regarding “lags in effect”!
Looking to the right of the second dotted vertical line on the Divisia M4 & Velocity chart above, we observe that with velocity growing at a very stable rate and a gradually declining money supply growth, the excess supply of money is gradually being reduced, implying that aggregate spending growth and inflation are also gradually declining. In other words, the economy is on the right course to regain nominal stability.
Will that happen? Unfortunately, the Fed cannot be trusted to “do the right thing”. If you ask yourself “what has the Fed´s interest rate tergeting done for the economy”?, you´ll likely conclude that it has done more damage (the banking crisis) than any good in reducing inflation!
PS: The Fed got it right but “without knowing why”! It was a deep recession in 2020, but the shortest on record! The recovery (defined as NGDP getting back to the trend path, not when it gets back to the previous high!) was also extremely fast. I was hopeful that they had figured what it was all about. Unfortunately not, because they “kept on going”…
Contrary to the Divisia aggregates, money is still too loose. N-gDp is still too high.
https://centerforfinancialstability.org/amfm/Divisia_Feb23.pdf
Atlanta gDpnow’s latest estimate for R-gDp in the 1st qtr.: 2.5 percent — April 14, 2023. That combined with the inflation rate puts N-gDp too high. In contrast, Divisia #'s show a contraction.
re: "Volcker achieved his goal."
Paul Volcker’s version of monetarism (along with credit controls: the Emergency Credit Controls program of March 14, 1980), was limited to Feb, Mar, & Apr of 1980. With the intro of the DIDMCA, total legal reserves increased at a 17% annual rate of change, & M1 exploded at a 20% annual rate (until 1980 year’s-end).
Why did Volcker fail? For two reasons. The first was the failure to recognize monetary lags. Contrary to Nobel Laureate Dr. Milton Friedman, lags are not “long and variable”. The distributed lag effects for both real output and inflation have been mathematical constants for over 100 years.
Second was due to Volcker's operating procedure (which hasn’t changed since Paul Meek’s (FRB-NY assistant V.P. of OMOs and Treasury issues), described in his 3rd edition of “Open Market Operations” published in 1974. Volcker targeted non-borrowed reserves when at times 200 percent of all reserves were borrowed.
One dollar of borrowed reserves provides the same legal-economic base for the expansion of money as one dollar of non-borrowed reserves. Legal or required reserves represents the monetary base.
The fact that advances had to be repaid in 15 days was immaterial. A new advance could be obtained, or the borrowing bank replaced by other borrowing banks. That's before the discount rate was made a penalty rate (Bagehot's dictum). And the fed funds "bracket racket" was simply widened, not eliminated. Monetarism has never been tried.
Monetarism involves controlling total reserves, not non-borrowed reserves as Paul Volcker found out. Volcker targeted non-borrowed reserves (@$18.174b 4/1/1980) when total reserves were (@$44.88b).
Then came the "time bomb", (which Dr. Leland Prichard foretold), the widespread introduction of ATS, NOW, and MMMF accounts at 1980 year end -- which vastly accelerated the transactions velocity of money (all the demand drafts drawn on these accounts cleared thru demand deposits (DDs) – except those drawn on Mutual Savings Banks (MSBs), interbank, and the U.S. government).
This propelled N-gNp to 19.2% in the 1st qtr 1981, the FFR to 22%, and AAA Corporates to 15.49%. My prediction for AAA corporate yields for 1981 was 15.48%.
Volcker tamed inflation by imposing reserve requirements on NOW accounts in April 1981.