
Monetary Policy in the two longest expansions
Monetary Policy in the two longest expansions
Where the target level makes all the difference

This piece from the AIER “Monetary Policy since the Great Recession” caught my eye for being weird. It starts off with:
After the 2007-2009 financial crisis, the Great Recession it precipitated, the exceptionally sluggish recovery, and now the pandemic recession, the U.S. has essentially entered a new macroeconomic environment. For most of the 2010s there was a general consensus that inflation was not too much of a problem. This very complacency has now set the stage for higher inflation by limiting our viable policy options.
And ends with:
None of the foregoing necessarily matters until the Fed needs to fight inflation. However, the minute the Fed realizes it needs to worry about inflation, it will become obvious that it has painted us into a corner…
…The U.S. economy has now entered unexplored territory, though this territory has unhappy similarities with Revolutionary-era hyperinflation, Civil War inflation of the 1860s, and the stagflation of the 1970s. None of these historical experiences were something anybody would want to relive.
The punch line is that over the past 30 years (not just the past 10), inflation was not much of a problem Because the Fed was mostly successful in obtaining Nominal Stability. We can check that out.
According to the NBER´s Business Cycle Dating Committee (BCDC), the expansion that began in June 2009 ended in February 2020, having lasted 128 months, eight months more than the March 1991 – March 2001 expansion.
A comparative analysis of these two long expansions should be useful. I´ll fudge the dates of the 1991 – 2001 expansion, extending it to the end of the next cycle that began in November 2001 and ran through December 2007. The only reason behind this extension is to bring out the importance of a stable level path of NGDP. [Note: The 2001 recession was more like a growth retrenchment, with year-on-year real growth never turning negative. Also, the popular rule of thumb of negative real growth in two successive quarters never materialized].
What separated these two long expansions was the deep and longest post war recession that went on from December 2007 to June 2009 (18 months), being known as the Great Recession.
The main statistics (average over periods) for the two expansions is illustrated below:

The charts are telling. In order to have all the data on a monthly basis, for RGDP & NGDP I use the monthly estimates of those variables (available from January 1992) provided by Macroeconomic Advisers.
The first panel illustrates the behavior of NGDP & RGDP relative to the Great Moderation trend level path.

During the first expansion, both NGDP & RGDP hug close to the trend for much of the time. During 1998-03, there is some instability in NGDP, which is mirrored in RGDP instability. Note that towards the end of the first expansion, although NGDP remains close to trend, RGDP falls significantly below trend. What is going on?
In the second expansion, both NGDP & RGDP remain on a stable level trend path that has been permanently lowered! Later I will examine the ‘transition’ from the high to the low trend path brought about by the Great Recession.
The next panel shows the behavior of prices, both the headline and core versions of the PCE during the two expansions.
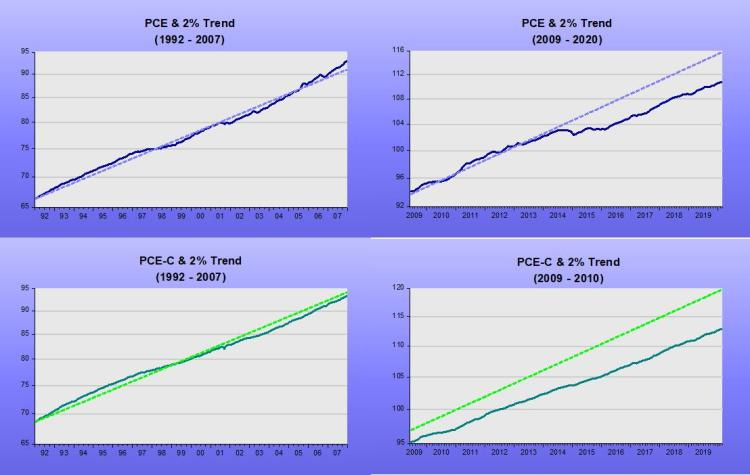
During the first expansion, both headline & core prices remained close to the 2% trend line from 1992. Towards the end of this expansion, just as RGDP fell below trend, headline PCE rises above trend. The fall in RGDP growth & rise in inflation implied by those moves is consistent with predictions of the dynamic AS/AD model in the case of a supply (oil price in this case) shock.
During the second expansion, after 2014, when oil prices dropped significantly, headline PCE shifted down and never “recovered”. Core PCE has remained significantly below the 2% trend and has risen at a rate below 2%.
The real and nominal output growth panel (and the price panel) indicate the two expansion phases were characterized by nominal stability. The differing characteristic is that during the recent long expansion, nominal stability followed a lower trend level path with lower growth.
To see how the economy transited from the “high” to the “low” path, I examine the details of the last years of the first expansion.
Those years were marked by oil shocks. As the dynamic AS/AD model tells us, growth slows and inflation rises. The best monetary policy can do in those instances is to keep aggregate nominal spending (NGDP) growth stable along the level trend path.
As the next charts indicate, the results are ‘model consistent’. An oil shock happened:

As predicted by the model, RGDP dropped below trend (real growth fell) and headline PCE shifted up (headline inflation increased):

NGDP, however, remained close to the trend level path, while Core PCE remained below the 2% level path, with core inflation remaining subdued:

The fall in real growth and the rise in headline inflation were the unavoidable consequence of the oil shock. Apparently, both Greenspan during his last year as Fed Chairman and Bernanke during his first two years as Chairman recognized this fact, keeping monetary policy on an ‘even keel’ (evolving close to the trend level path).
After that point, things unraveled. In the first six months of 2008, oil prices climbed an additional 44%. Headline PCE (and inflation) followed suit.

It is rare that a policymaker has the chance of putting his academic knowledge into practice. In 1997, Bernanke, with co-authors Gertler & Watson, published a paper titled:
“Systematic Monetary Policy and the Effects of Oil Price Shocks”.
In the conclusion, they state:
“Substantively, our results suggest that an important part of the effect of oil price shocks on the economy results not from the change in oil prices, per se, but from the resulting tightening of monetary policy. This finding may help to explain the apparently large effects of oil price changes found by Hamilton and many others.”
At that point, June 2008, monetary policy was “crunched”, with NGDP growth turning negative! No wonder the “effects of the oil price changes became large”, and the recession became “Great”.

The problem, I believe, is that Bernanke´s mind became increasingly focused on inflation. In that same year (1997) he had published a paper (coauthored with Frederick Mishkin) titled:
Inflation Targeting: A New Framework for Monetary Policy?
At that time he was still “flexible”, concluding that IT “construed as a framework for making monetary policy, rather than rigid rule, has a number of advantages…”
It seems “rigidity” set in because eleven years later, concluding the June 2008 FOMC Meeting, Bernanke states:
“My bottom line is that I think the tail risks on the growth and financial side have moderated. I do think, however, that they remain significant. We cannot ignore them. I’m also becoming concerned about the inflation side, and I think our rhetoric, our statement, and our body language at this point need to reflect that concern.We need to begin to prepare ourselves to respond through policy to the inflation risk; but we need to pick our moment, and we cannot be halfhearted.”
Bernanke´s timing could not be worse because at that point, June 2008, a recovery appeared to be incipient. The rest, as they say, is history. The economy never recovered so the “longest expansion” should never be hailed or become a paradigm.
Appendix:
As the charts below indicate, the US economy has always recovered from deep recessions, even from the “Great Depression”. By recovery, I mean that the economy climbs back to where it should have been if not for the recession/depression. As the bottom right chart indicates, the economy never recovered from the Great Recession.

A big problem is that monetary Policy is “guided” by unobservable variables. The concept of “potential” output, for example, says that if real output is above “potential”, monetary policy should be tightened, because otherwise inflation will rise. Conversely, if real output is below “potential”, monetary policy should be loosened, otherwise inflation will fall.
The fact is that when guided by unobservable variables, monetary policy becomes a “matching game”.
The charts below indicate that when actual output is above the initial estimate of “potential”, “potential” output is systematically revised up until it “matches” actual output. The opposite happens when actual output is below initial estimates of “potential”. Note that in the first case, inflation, instead of rising was falling and remained low thereafter, while in the second case it remained low throughout.

This imparts a tightening bias to monetary policy. In the “longest expansion”, this bias proved “mortal”.
PS: Note that I make no mention of the house price bust or financial troubles, usually pinned as “causes” of the Great Recession. I believe those were minor actors in the “movie”. The “movie was a box-office bust” because monetary policy, the “leading actor”, forgot its lines!