
"Mommy, my charts are telling me stories"
"Mommy, my charts are telling me stories"
about the pervasive effects of monetary policy on the economy

(Note: the title is a tribute to my 3 year old granddaughter who recently, waking up after a long flight from London to San Francisco, came up with a beautiful expression for “I was dreaming” saying: “Mommy, my eyes were telling me stories”)
Setting the stage
The two charts below tell the story of aggregate nominal spending (NGDP) growth and real GDP (RGDP) growth over the past 30 years.
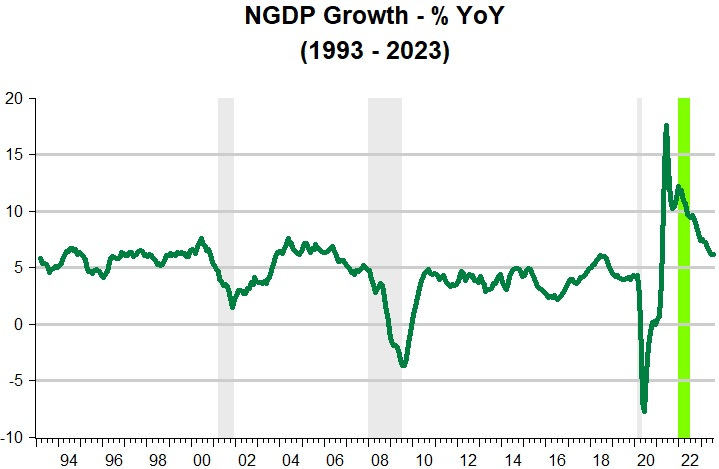
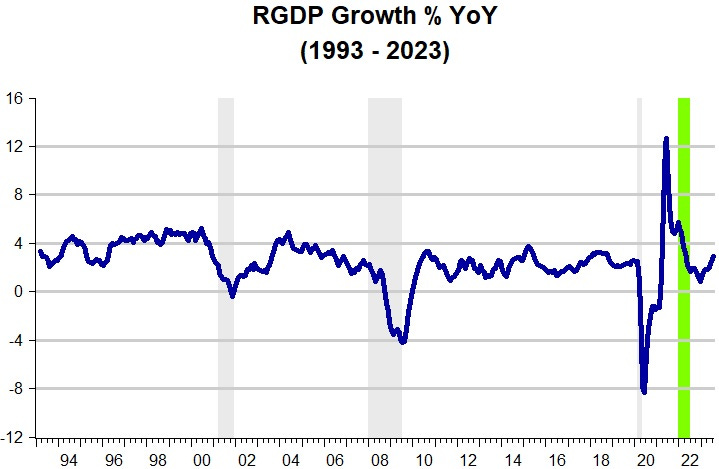
The shaded (gray) bars denote periods of recession. I´ll talk about the green bar later.
Common to the 3 recession periods is a sudden drop in NGDP growth. Since NGDP growth is fundamentally determined by the Fed through the conduct of monetary policy, the three recessions experienced during the last 3 decades (2001.03 - 2001.11, 2007.12 - 2009.06, 2020.02 - 2020.04) were all demand determined recessions, brought about by a tightening of monetary policy (synonimous with falling NGDP growth resulting from an excess demand for money).
The question then is: Why was monetary policy (which is not necessarily related to interest rate policy) tightened?
The first thing that comes to mind is: because inflation was at risk of rising. But if you believe, as I do, that inflation is a monetary phenomenon, why would inflation be at risk of rising if NGDP growth was relatively stable during the periods preceding the drop (i.e. there was no excess supply or demand for money)?
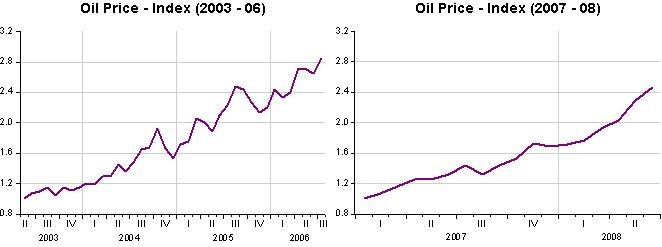
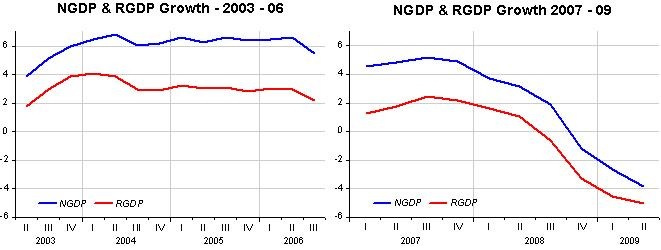
Quite a few would say: because oil prices were rising. And they wouldn´t be wrong. Prior to the 2001 recession, between early 1999 and late 2000 oil prices more than doubled. Again, between early 2007 and mid 2008, oil prices also more than doubled.
But this cannot be the full story because between late 2003 and mid 2006, oil prices also more than doubled. This time there was no monetary policy tightening (NGDP growth remained stable) and no recession.
A “zoom-in” on the two periods is illustrative. Two equivalent oil shocks and two very different outcomes!
The above is consistent with Bernanke et al conclusion from 1997:
Substantively, our results suggest that an important part of the effect of oil price shocks on the economy results not from the change in oil prices, per se, but from the resulting tightening of monetary policy. This finding may help to explain the apparently large effects of oil price changes found by Hamilton and many others.
While some would say the risk of inflation rising was due to oil prices going up, others would say: because unemployment was too low. That worry comes from the believers in the Phillips Curve, who think “too low” unemployment spells rising inflation (and over time, there have been many of those at the Fed). And today, that group argues that to get inflation back to 2% unemployment will have to markedly increase!
The chart below indicates that in fact, monetary policy was tightened after unemployment fell to “low levels”.

We saw that before the 2001 and 2007-09 recessions, oil prices were on the rise. Coincidentally, before both recession episodes, unemployment was also “uncom fortably low”. However, although oil prices were on the rise in 2004-05, there was no monetary tightening and therefore no recession. The Phillips Curve sect would point to the fact that in 2004-05, unemployment was still “comfortably high”!
I think it doesn´t matter if the Fed was paying attention to oil prices or unemployment. The fact remains that the monetary tightening in 2001 and after 2007 was a mistake. The first mistake was not very costly, but the second was high enough and should have led to mass firings at the Fed. I know that my opinion is not widely shared because in 2009 BB was named by Time Magazine “Person of the Year” and dubbed “the “overlord” of the global economy, who coolly steered the world away from economic disaster.”
The next chart “relives” inflation, both headline and core, for the period. Excluding the recent post C-19 period, while core inflation was subdued, sometimes excessively so relative to target, towards the end of the 1990s headline inflation begins to swing to the beat of oil prices.
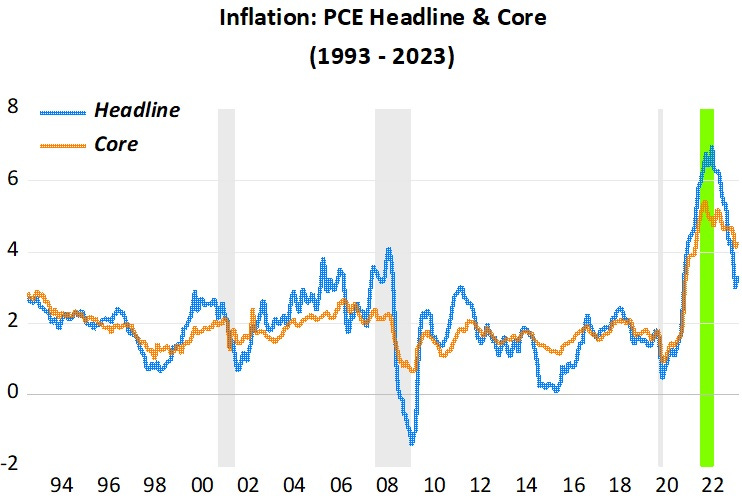
For most of the 1990s, supply shocks from energy and food prices were not relevant, so both headline and core inflation are mostly the same. Note that in 1997-98, both headline and core inflation fall significantly. This is due to the positive productivity shock the economy experienced at the time. Headline inflation fell a bit more, influenced by the fall in oil prices due to the Asia crisis.
Oil prices picked up again in 1999, and this is reflected in the positive difference between headline and core inflation.
I think the evidence is clear to indicate that the Fed should not react to shocks in oil prices, productivity shocks or “low” unemployment. The end result will be more instability. What, then, should the Fed do? The best would be if it tried to keep NGDP growth as stable as possible since that would be consistent with stable real growth and low and stable inflation & falling unemployment. Those outcomes were evident during the periods NGDP growth was stable.
The post C-19 period
Looking at the green bar towards the end of the period, it marks the only time, during the post C-19 period that the economy was buffeted by a negative supply shock, flowing from the increase in oil prices from the Russian invasion of Ukraine. Until then, what the economy experienced was a classic demand shock, with both headline and core inflation “hugging” together (and real output growth rising).
Many argue that the inflation experienced since early 2021 is mostly due to supply shocks. Certainly supply impediments played a part, but the fact that inflation and real growth move in the same direction is prima facie evidence for the predominance of a demand shock. During the “war shock”, we note that while inflation rises, real growth falls, evidence for a predominace of supply shocks, even though aggregate spending (NGDP) growth was also coming down.
More recently, we have evidence that positive supply shocks are gaining the upper hand. Until recently, oil prices were down but more importantly, the suppljy disruptions from the pandemic are waning and the economy normalizing. Even with NGDP growth being reduced, real output growth is rising and inflation falling!
What´s different in the C-19 induced cycle?
Different not only from the two previous cycles in the last 30 years but also different from those in the 80s, 60s and 50s (leaving aside the 70s “contaminated” by ugly food & energy shocks).
They were all Fed-induced, with monetary policy being tightened through either a fall in money supply growth (given money demand growth, or v) or by the Fed being “stingy” and not adequately offseting falls in velocity (increases in money demand growth).
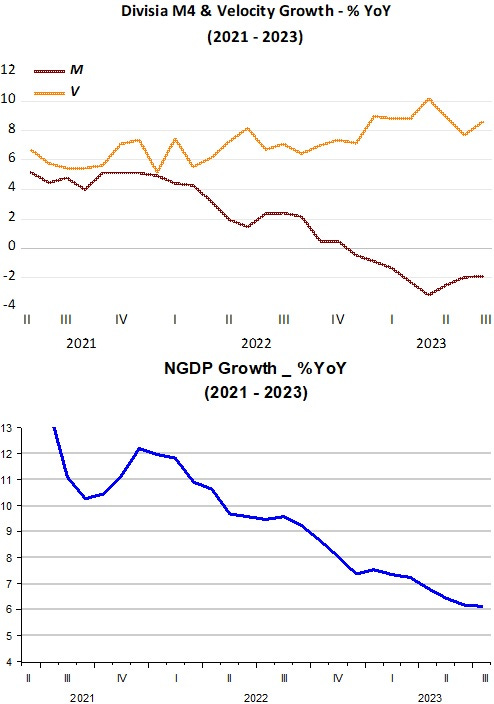
The C-19 cycle was not Fed-induced. The sudden surge of the pandemic in early 2020 led to a sudden and massive increase in money demand (mammoth drop in velocity). The Fed reacted quickly cranking-up the broad money supply. Although deep, the recession was the shortest on record (just 2 months).
One year later, in February 2021, things were almost “normal”. Nominal and real output were close to their previous trend level path, inflation was closing on target and unemployment had dropped from almost 15% to 6.2%.
A very rare instance of expansionary monetary policy
In their recent study “Does monetary policy matter? The narrative approach afeter 35 years” Romer & Romer write:
An important extension that we do in the new work is to broaden the criteria to include expansionary monetary policy shocks.
In particular, we now also look for times when policymakers believed that they were at a stable level of economic activity, but took actions to lower the unemployment rate—and were willing to accept adverse consequences for inflation.
That is, we look for times when policymakers were deliberately shifting the aggregate demand curve out because of a change in their view of the acceptable or desirable level of unemployment. If monetary policy has real effects, output should rise following such actions.
It appears, however, that “taking expansionary actions to lower unemployment” has not been very “popular” since they only find one instance, over the 1947 - 2016 sample, that monetary policy was expansionary, and that´s more than 50 years ago, in January 1971.
If they had the 2021 year in their sample, they would have without any doubt considered it an example of an expansionary monetary policy shock, only the second in the post war economic history!
The unassailable evidence for that is that in February 2021 Powell gave a speech entitled “Getting back to a strong labor market”. Apparently, the 6.2% rate of unemployment at the time was “uncomfortably high” (remember, however, that in 2003-04, 6.2% unemployment was “comfortably high, not requiring tightening of monetary policy!)
Recognizing the economy's ability to sustain a robust job market without causing an unwanted increase in inflation, the statement says that our policy decisions will be informed by our "assessments of the shortfalls of employment from its maximum level" rather than by "deviations from its maximum level."12 This means that we will not tighten monetary policy solely in response to a strong labor market.
Not surpringly, after Powell´s “signal”, nominal and real growth rose robustly, unemployment fell and inflation took off!
This time around that rarity, a “soft landing”, is a distinct possibility
What usually happens is that the Fed tightens when, for whatever real or imaginary reason, it fears inflation will rise. That tightening of monetary policy (see the first chart above) is reflected in a fall in NGDP growth (and a fall in RGDP growth, a fall in inflation and an increase in unemployment).
This time around, the Fed adopted an expansionary monetary policy. This is reflected in the increase in NGDP growth (and a rise in RGDP growth, a rise in inflation and a fall in unemployment).
The difference between now and past occasions, is that the Fed is “adjusting from above”. In other words, monetary policy is tightening, not to take NGDP growth down below its “normal” or stable value, but to bring it down to the stable level!
Ignore, for simplicity, the oil price shock associated with the Russian invasion. Monetary policy began to be (initially gently) tightend in mid 2021, long before the Fed Funds rate began to rise. This was done by allowing broad money growth to fall (and even become negative) to gradually offset the rise in velocity (fall in money demand growth). The outcome is a continuously falling NGDP growth, which will hopefully, if the Fed avoids overshooting, bring NGDP growth to the 4% - 5% stable growth.
The charts illustrate.
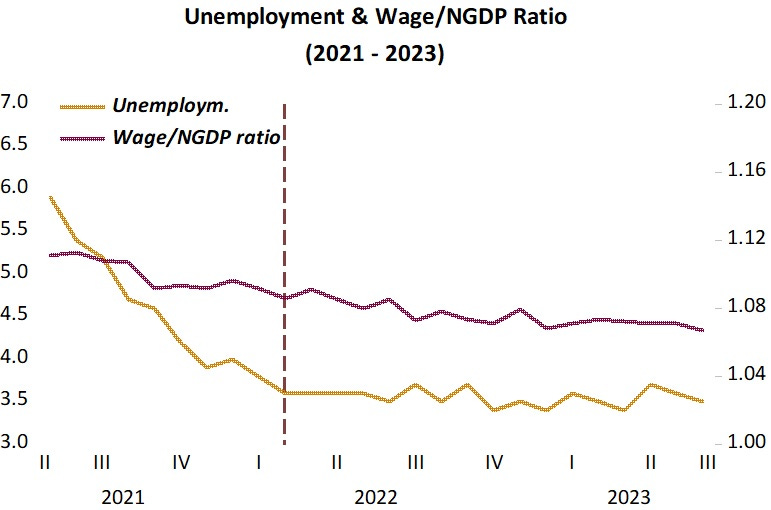
What about the “mystery” of the falling/low unemployment rate going hand in hand with the drop in inflation?
With NGDP growth adjusting “from above”, the rate of NGDP growth was sufficiently high to keep the wage/NGDP ratio (an important determinant of the level of unemployment) falling, with the result that unemployment also fell. In mid 2022, NGDP growth had fallen by enough to keep the wage/NGDP ratio relatively stable. The result: a stable low rate of unemployment (with inflation falling, a “miracle” to the PC “fanatics”).
The chart brings it out.
I believe the implications of the above for the Fed are pretty clear, so I worry that, as Powell said in Jackson Hole (and not for the first time”) the “Fed is navigating by the stars under cloudy skies”!