Since Spring 2020, Steve Hanke (among others) has been predicting am increase in inflation resulting from the strong rise in money supply. Now, he predicts recession from a too low increase in the money supply. A few days ago he wrote:
Before taking up the “errors” that pervade this comment, I take issue with Hanke´s focus on M2 money supply. After all, Hanke is a Special Counselor at the Center for Financial Stability, which provides the Divisia measure of money supply indices.
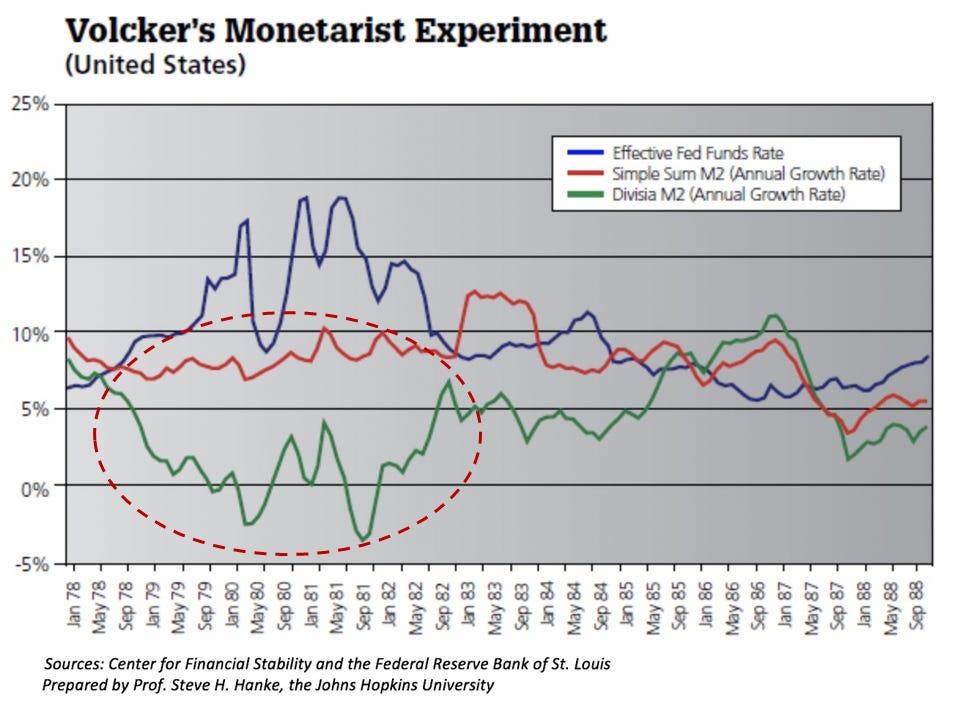
Volcker achieved his goal. By 1982, the annual inflation rate dropped to 3.8%—a great accomplishment. But, the problem was that the Volcker inflation squeeze brought with it a relatively short recession (less than a year) that started in January 1980, and another, more severe slump that began shortly thereafter and ended in November 1982.
Paul Volcker’s problem was that the monetary altimeter installed on his dashboard was defective. When my friend Volcker looked at his M2 gauge, he was viewing M2 data that were calculated by a simple summation of their components—the normal Fed procedure.
As shown in the chart below, the Fed thought that double-digit fed funds rates that it was engineering allowed it to tap on the money-supply brakes with just the right amount of pressure. In fact, if the money supply had been measured correctly by a Divisia metric, Volcker would have realized that the Fed was not just tapping on the breaks, but unnecessarily slamming on them from 1978 until early 1982. The Fed was imposing a monetary policy that was much tighter than it thought—an excessive tightness that resulted in two recessions.
Now I´ll analyze his comment. Take this view:
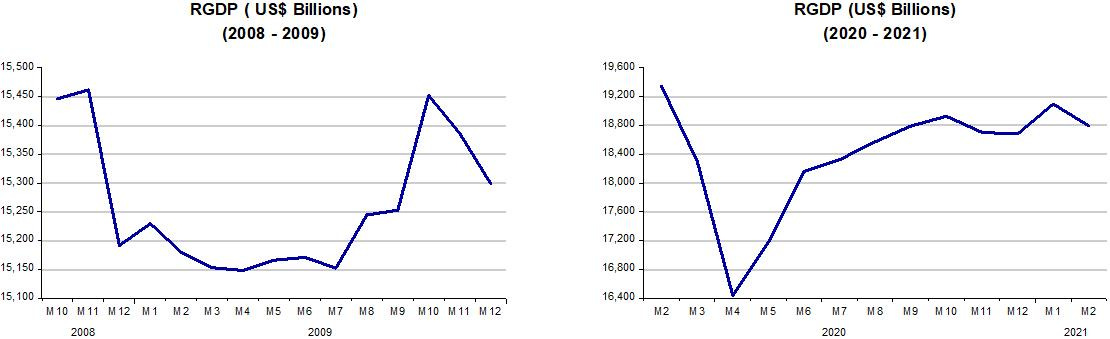
By analyzing the money supply during the global financial crisis, which started in 2008, and our current inflation, we can see why the U.S. economy and inflation behaved differently in those two periods. It’s all about money, not fiscal policy, supply chains or energy prices.
However, when you look at the charts below, you´ll have a hard time understanding that characterization! While in 2008-09, Divisia M4 money supply growth tanked, in 2020-21, it “exploded”. Meanwhile, inflation in 2008-09 and in 2020-21 were very similar, but real output (RGDP) dived deeper but recovered much faster in 2020-21.
(Note: For a detailed analysis of the post pandemic period, including the role of supply shocks and supply constraints, and how the Fed can lead the economy to a “soft landing”, see my “It´s a kind of magic”)
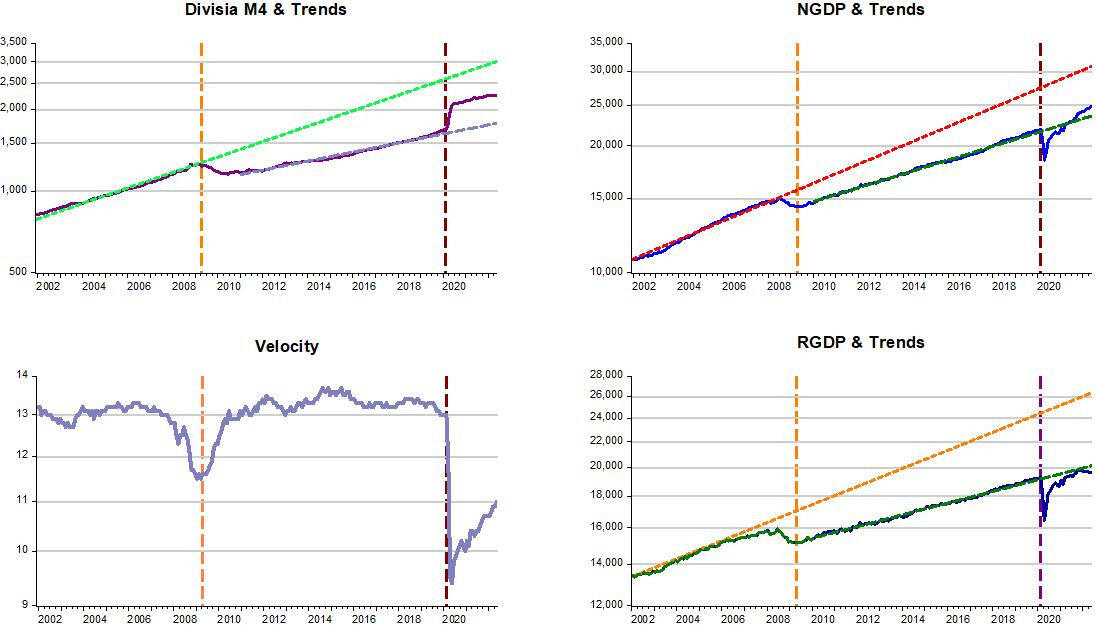
Clearly, it´s not “all about money”. In fact it is, but not only about money supply. We must take into account money demand (or its inverse, Velocity).
I´ve found out that sometimes economic analysis, usually focused on growth rates, miss relevant aspects of some questions. The charts below depict the relevant variable in levels.
Note that when Velocity began to fall after mid-2007, Money Supply remained on it´s trend level path. With Velocity falling and Money Supply not offsetting that move in Velocity, both NGDP & RGDP dropped below trend. However, when Velocity began to climb back to trend, Money Supply fell below trend before travelling along a lower level (and growth) path.
In practice, what monetary policy did was to “condemn” the economy, both in nominal & real terms, to a lower level and growth path!
When the pandemic hit, the behavior of monetary policy was very different, with money supply quickly reacting to the massive drop in velocity. That´s why both NGDP and RGDP recovered fast, with inflation remaining mute, at least until RGDP hit the supply constraints resulting from the pandemic.
Just imagine the kind of depression that would ensue if the Fed had kept money supply rising along the path it was travelling on!
Now, to Hanke, money supply (even if it´s the deficient measure of money) is growing “too little” and if it remains so, a recession will likely began later this year!
That conjecture misses the point by ignoring what´s happening to Velocity. Although still well below the level prior to the pandemic, Velocity is rising and what the Fed has to do is conduct monetary policy by calibrating the “Thermostat” to adequately offset the rise in Velocity so as to keep NGDP on a stable trend path.
On an endnote, when the Fed is doing its job well, economists tend to think money is irrelevant!
An example from Krugman (taking the opposite view from Hanke, who is also mistaken to think that Money Supply is all that matters)!
And while it took a while, my sense is that by 2014 or so the great majority of economic commentators had accepted that looking at the money supply in the U.S. context offered basically no information about future inflation.[or nominal GDP]
there is no money figure standing alone that can be used to accurately forecast the economy. Both the 10mo roc in DDs and the 24mo roc in DDs crater in November (but that time series is not as accurate as required reserves).
"The “true” or Rothbard-Salerno money supply measure (TMS)—is the metric developed by Murray Rothbard and Joseph Salerno, and is designed to provide a better measure of money supply fluctuations than M2. This measure of the money supply differs from M2 in that it includes Treasury deposits at the Fed (and excludes short-time deposits and retail money funds)."
That makes some sense with the exception of the Treasury's General Fund Account, because those balances aren't always quickly used. What you can't predict is the demand for money (the inverse of velocity). So, we could be in a recession.
Ben Bernanke, all by himself, caused the GFC (bankrupt half the home builders). Bernanke’s was wrong. See: "21st Century Monetary Policy: The Federal Reserve from the Great Inflation to COVID-19.":
“a flawed and over-simplified monetarist doctrine that posits a direct relationship between the money supply and prices”.
As soon as Bernanke was appointed to the Chairman of the Federal Reserve, he immediately initiated, his first "contractionary" money policy for 29 contiguous months (coinciding both with the end of the housing bubble, and the peak in the Case-Shiller's National Housing Index in the 2nd qtr. of 2006 @ 189.93), or at first, sufficient to wring inflation out of the economy, but persisting until the economy plunged into an economic wide depression).
For > a 2 year period, RoC’s in M*Vt, proxy for inflation (for speculative assets), were NEGATIVE (less than zero!).*
Unfortunately, when long-term money flows peaked in July, which was reported with a lag on Aug 14, 2008 · when the government announced that the annual inflation rate surged to 5.6% in July - the highest point in 17 years; after July, both the RoC in short-term money flows and long-term monetary flows, simultaneously, fell off a high cliff (because of the lag effect of money flows).
Money market and bank liquidity continued to evaporate despite the FOMC's 7 reductions in the target FFR (which began on 9/18/07 until 4/30/08). Bernanke didn’t initiate an “easy” money policy, continuing to drain liquidity, despite Bear Sterns two hedge funds that collapsed on July 16, 2007, and immediately thereafter filed for bankruptcy protection on July 31, 2007 -- as they had lost nearly all of their value.
Bernanke’s 29 contiguous months of a massive contraction of American Yale Professor Irving Fisher’s price level, the massive tightening of monetary conditions in the US. caused a sharp rise in E-$ money, in E-$ demand. Foreign central banks did not have direct access to dollar liquidity swaps from the Fed (as illustrated by the sharp drop in EUR/USD from close to 1.60 in July 2008 to 1.25 in early November 2008).
BuB didn’t even begin to try and ease monetary policy until Lehman Brothers later filed for bankruptcy protection (it was one the Federal Reserve Bank of New York’s primary dealers in the Treasury Market, disrupting the primary dealer system), on September 15, 2008. The next day AIG’s stock dropped 60%. I.e., BuB maintained his “tight” money policy [i.e., credit easing, or mix of assets, not quantitative easing --injecting new money and excess reserves]. BuB literally didn’t ease monetary policy until March 2009 (when the rate-of-change in money flows finally reversed, when stocks turned).
The FOMC’s “tight” money policy was due to flawed Keynesian dogma (using interest rate manipulation as a monetary transmission mechanism), rather than by using open market operations of the buying type so as to expand legal reserves and the money stock -- and thus counteract the surgically sharp fall in AD, esp. during the 4th qtr. of 2008.
On January 10, 2008 Federal Reserve Chairman Ben Bernanke pontificated: "The Federal Reserve is not forecasting a recession”.
Bernanke subsequently initiated the economy’s coup de grâce during July 2008 (his second ultra-contractionary money policy). The 3rd contractionary policy was the introduction of the payment of interest on excess reserves, which destroyed non-bank lending/investing (the 1966 S&L credit crunch, where the term was first introduced, is the economic antecedent and paradigm).
Note aside: the 2 year rate-of-change, RoC in M*Vt (which the FED can control – i.e., the RoC in N-gDp), peaked in the 2nd qtr. of 2006 @ 12%. Bernanke let it fall to 8% by the 4th qtr. of 2007 (or by 33%). N-gDp fell to 6% in the 3rd qtr. of 2008 (another 25%). N-gDp then plummeted to a -2% in the 2nd qtr. of 2009 (another - 133%). That’s what created the cry, epitomized by Scott Sumner, for targeting N-gDp.
By withdrawing liquidity from the financial markets (draining legal reserves and the money stock), risk aversion was amplified, haircuts were increased, additional and/or a higher quality of collateral was required, liquidity mis-matches were magnified, funding sources dried up, long-term illiquid assets went on fire-sale, non-bank deposit runs developed (the ECB, which routinely conducts open-market operations “with more than 500 counterparties throughout the Euro Zone), withdrawal restrictions were imposed, forced liquidations lowered asset values, counterparties’ credit default risks mushroomed-- all of which contributed a general crisis of confidence & frozen financial markets (regulatory malfeasance was a subordinate factor). I.e., BuB turned Yale Professor Irving Fisher’s “price level”, or otherwise safe-assets, into impaired and unsaleable assets (i.e., upside down and under water).