
Justifying Powell´s "lack of confidence"
Justifying Powell´s "lack of confidence"
but getting the stance of monetary policy wrong!

For the past couple of months, we´ve frequently heard from Powell and other members of the FOMC that they are “not confident” that inflation is on the way to the 2% target, and that, therefore, rates will “remain higher for longer”. A few outsiders have even speculated that the next rate move is likely to be upward!
In an effort to “justify” Powell´s “lack of confidence”, two researches at the Federal Reserve Board have publised a paper entitled “Lessons from Past Monetary Easing Cycles” where they write:
Many central banks are at a critical juncture in their current monetary policy cycles as they assess whether it would be appropriate to embark on an easing phase following one of the most aggressive episodes of monetary tightening in recent history. In this note, we highlight key aspects of past monetary policy easing episodes in selected advanced economies and what lessons we may learn from these past experiences.
Reviewing the historical record, we identify instances where monetary policy was tightened in response to increased inflation, and subsequently dialed back when inflationary pressures abated. From these selected "inflation-abating" episodes, we show that only a minority can be categorized as "inflation-success" where inflation indeed settled close to Central Banks' target.
In short, maybe “higher for longer” is the best option!
Unfortunately, the basic premise of the paper is flawed, believing that rate increases spell monetary tightening and rate cuts mean monetary easing. Also, the view that “monetary policy was tightened in response to increased inflation, and subsequently dialed back when inflation pressures abated” is hard to see in the US data.
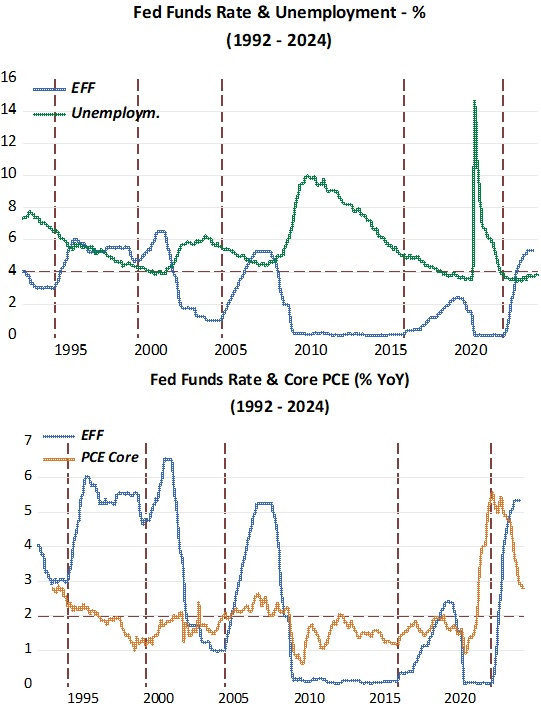
Between 1992, and 2020, core pce inflation averaged 1.7%, while headline pce inflation averaged 1.8%, both a little below the 2%, initially implicit and later explicit, target.
From the charts below, it appears that rates react more closely to the unemployment rate than to inflation. That´s likely because the Fed, and many others, believe “low” unemployment “anticipates” an increase in inflation. In that case, increasing rates when unemployment becomes “too low” is “thought”to be the reason inflation remained low and stable during this period!
The vertical bars denote the moment when rates began to rise.
Some comments:
When the first rate hike in this period took place, in early 1994, inflation was falling and so was unemployment. But the unemployment rate was getting “dangerously” close to 6% (which at the time was thought to be the value of NAIRU - non-accelerating inflation rate of unemployment). And with rates having remained unchanged at 3% for a year, the Fed thought it was the time to start hiking it. And rates doubled from 3% to 6% in a relatively short time!
Despite the hike in rates, unemployment went on falling, as did inflation after a while (mostly influenced by positive productivity shocks). Could this be referred to as a “tightening” of monetary policy? I don´t think so.
When another rate hike took place, after March 1999, inflation was significantly below target. Unemployment, however had reached 4%, which was by then (as thereafter) though to be the absolute minimum unemployment could go before “igniting” inflation!
The outcome of this mistake was the 2001 recession and a significant increase in unemployment. When the Fed realized its mistake, it quickly began to reduce rates, which in time reached 1%. This was really no “easing” of monetary policy. Inflation remained low, while unemployment went on rising for a while, with the period getting dubbed the “job-loss (non)recovery”.
In 2004, another rate hike. This time around, “low” unemployment was not the reason. It had just begun falling but was still elevated. While core pce inflation was right on target, headline inflation was on the rise due the oil price shock that was fanning the inflation flame.
Unemployment went on falling while the “pass-through” of the oil price increase (which more than doubled), was contained, with core inflation being below 2.5% at all times.
By mid-2007, the Fed felt someting was wrong. That was the incipient Financial Crisis (later known as GFC). Unemployment was begining to increase and core inflation remained contained. The Fed brought rates down rapidly from over 5% to close to zero.
In spite of all the monetary policy “easing”, inflation dropped well below target and unemployment jumped to 10%! The only logical conclusion is that this was no “easing”, but a strong “tightening” of monetary policy!
In late 2015, the Fed thought “enough was enough” with “zero” rates and in December undertook the first hike in 7 years! Unemployment which had fallen gradually but significantly from its “Great Recession” high, stopped falling for a little while, and inflation remained below target.
Interestingly, shortly after the december 2015 hike, in early January, no less that the Fed Vice-Chair, Stanley Fischer, said that four rate hikes in 2016 was in the ballpark!
There was only one timid hike later in 2016! In 2017, rates continued to rise (monetary policy “tightening”?). Unemployment went on falling to below 4%.
Suddenly, in mid-2019 (that´s seven months before the first signs of Covid-19), the Fed must have thought that “someting was not right”. After all unemployment was below 4% and inflation was stuck below target.
So they must have thought someting along the lines of “maybe we made a mistake hiking rates after 2015, maybe the neutral (r*) rate remains very low, and we risk a recession down the road. After all, inflation has remained “too low” with very low unemployment”!
Then C-19 hit! But that´s another story, which I´ll look into further down…
What the story tells us so far, based on the two pictures above, is that it is at least temerary to associate moves up or down of the Feds policy rate with “tightening” or “easing” monetary policy.
If not interest rates, what can we use to gauge the stance of monetary policy? The market monetarist school, which blossemed after 2009, when Scott Sumner, at the time a professor at Bentley University, began blogging, naming his blog The Money Illusion.
In short, to market monetarists, the best gauge of monetary policy is NGDP growth, not just any growth, but only the growth in excess (or short) of the a stable level growth path. In other words, when NGDP growth takes NGDP above the stable path, monetary policy is said to be expansionary. When NGDP growth takes NGDP below the stable path (which defines a state of nominal stability), monetary policy is said to be contractionary.
How, then, does the Fed determine NGDP growth? From the equation of exhange in growth form: m+v=p+y, where m is money supply growth, v is velocity growth, p is inflation and y is real output, m is the “thermostat”, the “dial” closely controled by the Fed, that strives to offset changes in the “outside temperature” (v) in order to keep the “inside temperature” (p+y=NGDP growth) stable.
The “monetary policy” chart below illustrates.
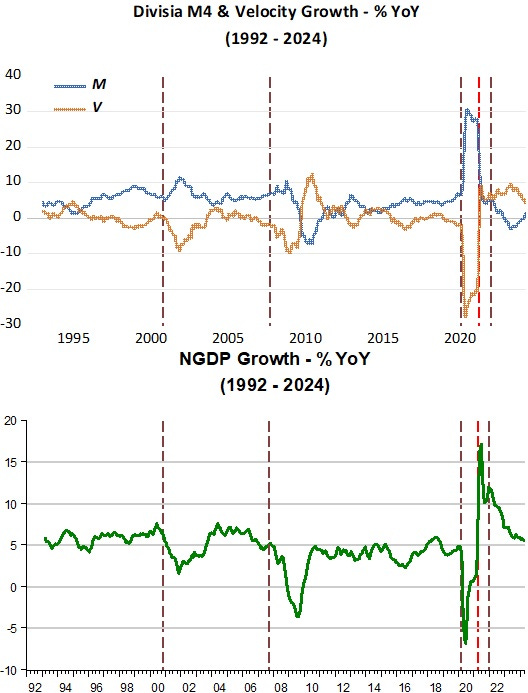
The brown vertical dotted lines indicate moments when monetary policy tightened. Those are the moments when the Fed fails in adequately offseting changes in velocity. Why does the Fed fail? Maybe because it is thinking about “bad stuff”, things like rising oil prices or too”low” unemployment, that would lead the Fed to tighten!
Note that monetary policy “tightening” in this structure has no correspondence with monetary policy “tightening” when interest rates define the stance of monetary policy!
Note also that when NGDP growth returns to its trend growth rate, it does not define monetary policy expansion (its just a “correction” of the previous monetary policy mistake!).
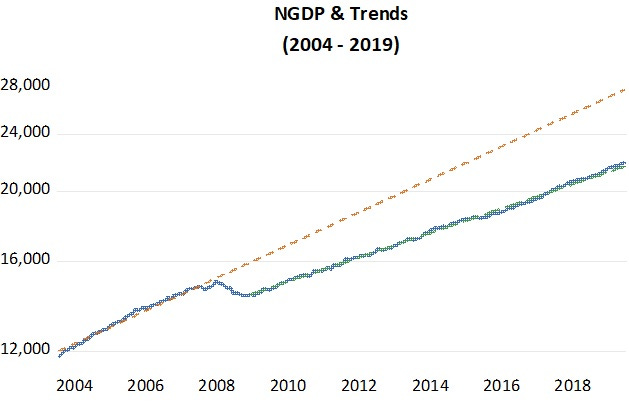
Interestingly, after the policy tightening that began in September 2007, even with interest rates going to “zero”, monetary policy remained tight (even though Fed officials and the public at large thought it was “extremely easy”!), with NGDP growth never going back to its trend growth rate. This can be clearly observed in the NGDP level chart below. Monetary policy tightens after late 2007, and remains tight, never allowing NGDP to rise to its previous trend path!
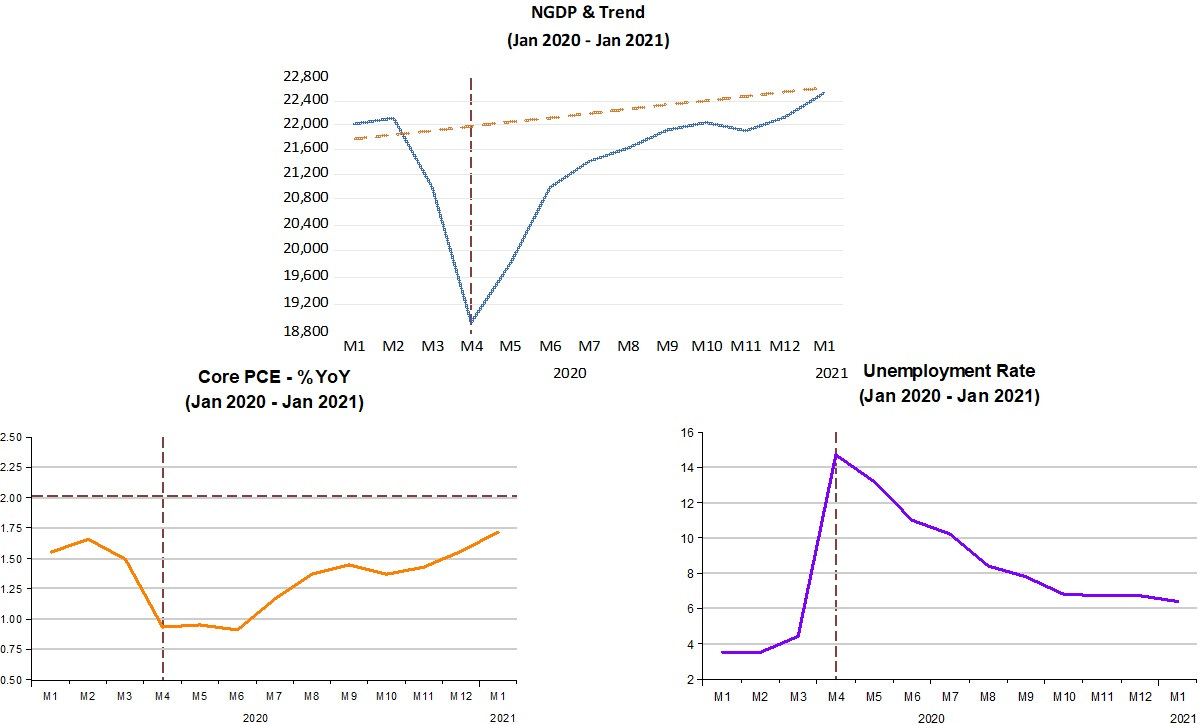
We then come to the point where C-19 hit in early 2020. The tightening in monetary policy that took place was not a “Fed failure”, being wholy due to the surprise attack by Covid-19. Actually the Fed reacted very quickly, bringing NGDP back to its post GR level path in a short period (remember the recession lasted only for 2 months!). Inflation stops falling and then climbs back towards target while unemployment falls fast.
The charts below illustrate.
The “monetary policy” chart below, is a zoom-in of the one for the 1992 - 2024 period presented above, concentrating on the post C-19 economy.
It shows that for the first time in the past 32 years that between March 2021 and December 2021 monetary policy was expansionary! Initially very strongly expansionary and then more mildly so, with NGDP growth retrenching somewhat.
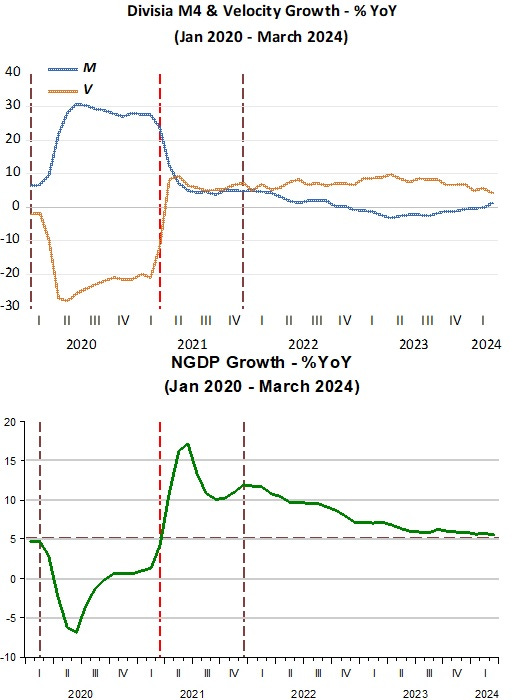
Ironically, this “unique” monetary expansion was triggered by the Fed, when Powell made a speech “Getting back to a strong labor market”. It´s ironic because usually the perception of a strong labor market/low unemployment was the trigger for the Fed to raise rates!
In the FOMC meeting following the speech we read that:
The Committee decided to keep the target range for the federal funds rate at 0 to 1/4 percent and expects it will be appropriate to maintain this target range until labor market conditions have reached levels consistent with the Committee's assessments of maximum employment and inflation has risen to 2 percent and is on track to moderately exceed 2 percent for some time.
He got more inflation than he wanted but the labor market strenghtened!
Since January 2022, monetary policy has gradually been tightened (coincidentally, soon after interest rates also went up), with NGDP converging to a 5% trend growth path. Some “purists” would argue that´not enough, because the Level of NGDP will be permanently higher. They didn´t “complain”, however, when the level of NGDP was maintained permanently lower after the Great Recession!
The takeaway is that it can be very costly to confuse the stance of monetary policy with the rate of change/level of interest rates. “Popular” ideas are not always “good” ideas!
That's an article for the entire class.
Nicely engaged with the paper!
I;'d like to point out the mistake of dichotomous "phases," at least in the setting of policy instruments. There is no reason for the Fed to act as if a movement in one direction at time time t rules out a reversal in time t+1. As Brad Delong points out. being data driven means that at any time one is as likely to move one way as the other