
"It´s a kind of magic"
"It´s a kind of magic"
The pathway to a "smooth landing"

If you haven´t signed up, please do and help increase my reader base (and please share)
I desperately wish I could think of something else, but can´t. It´s not inflation directly, but what´s behind it: Monetary Policy. More recently, the focus has moved from inflation to recession, viewed as the means through which inflation is controlled. Two examples.
The depth and length of the recession will largely be determined by how persistent inflation proves to be, and by how much pain the Fed is willing to inflict on the economy to bring it down to levels it deems acceptable.
But if I’m right, and the markets are right, the “flation” part of that story won’t last very long. And sooner than many people believe, the Fed may find itself reversing course, trying to undo the “stag.”
Is “pain” or “stag(nation)” a necessary part of controlling inflation? Although “experience” may answer on the affirmative, it may not be. The first order of business is to understand the nature of the inflation beast. To put things in perspective, I take a look at the past 7 decades.
The charts below depict NGDP (or aggregate nominal spending) and the corresponding behavior of inflation. For inflation I look at the Core PCE to leave out things like energy and food prices which are relative price changes due to exogenous shocks.
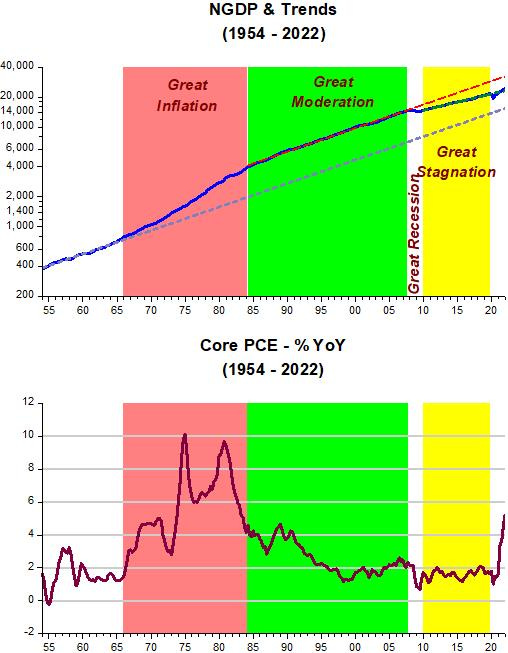
The “Great Inflation” come about because NGDP went on a rising trend (i.e. monetary policy went into expansionary mode). The peaks in inflation during that period are closely associated with the oil shocks in 1973-74 and 1979.
With inflation having gone “on a spree” for 15 years, expectations of rising inflation became entrenched. For the system to get rid of those expectations it had to go through a lot of “pain” (conveyed by high unemployment)
The important thing to note is that the Fed got rid of the inflation by stabilizing the path of NGDP, with NGDP growth returning to the rate experienced during the 10+ years before the Great Inflation (you see that by comparing the slopes of dotted blue trend line and the dotted red trend line). After some time, expectations adjusted.
The level of NGDP is permanently higher because due to the rising inflation, the price level was permanently increased (so that, even with a stable path of real output (RGDP) growth, P*Y, permanently rises).
The Great Recession was notable, because through massive monetary error, the Fed brought the level of NGDP down permanently and, not satisfied, also managed to reduce its trend growth rate (note the less steep NGDP growth path (green dotted line) after the GR).
Before looking at the kind of “magic” that can be perpetrated currently, let´s go deeper into the past!
We´ve seen the 7 decade behavior of NGDP (& inflation). However, what happened to RGDP during that period. The next chart illustrates.
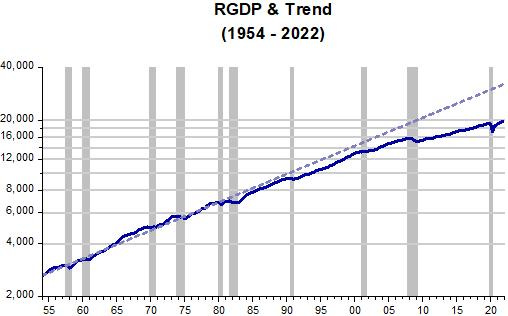
The blue dotted line is the pre Great Inflation trend. Recessions are marked by the gray bars. Note that despite all the upheavals; GI, food and energy shocks, among others, real output evolved very close to trend (which grows at a 3.7% YoY rate). That remains mostly true until the end of the 1980s.
The 1990/91 recession permanently lowers the level of RGDP (it´s rate of growth, however, remains essentially the same, with the RGDP line remaining parallel to the trend line).
Why the changed pattern? That´s still (as far as I know) an unsolved “mystery”. At the time, several voices thought that was “something novel”:
For example, in the summer 1992 issue of Challenge Magazine, Robert Brusca, chief economist at The Nikko Securities Co., wrote a long piece entitled Recession or Recovery? He writes: “... by all historical standards there should be a strong recovery (following the 1990/91 recession). But the economy is now so uncertain, we could be in for a triple-dip recession rather than a recovery...” and there follows several pages of comparative statistics on the behavior of all kinds of economic variables following a recession, with the conclusion being that since the economy had not yet shown the strong rebound that historically follows a recession, his view was that the recession had not yet ended, “appearing to be the longest since the Great Depression” (at about the time the article was published, the official date for the end of the recession was put at March 1991).
In the Fall 1992 issue of The Federal Reserve Bank of Minneapolis Quarterly Review, David Runkle (a senior economist in the research department) wrote: “... the current recovery is the weakest in the post war period in all measures of economic activity. This means that the current recovery is most appropriately viewed as a continuation of a long period of below average growth”.
More interestingly, Paul Krugman in his Age of Diminished Expectations (1994, page 108) writes: “... economists are still puzzled by the suddenness of the slump that developed in 1990, in particular by an abrupt decline in consumer confidence[1]... one answer is that during the early stages of the slump the Fed.’s mind was on other things. In the late 1980’s, there was considerable agitation by conservative economists and their congressional allies for a U.S. policy aimed not simply at holding the line on inflation but at achieving complete price stability. The Fed wasn’t prepared to launch another all-out war on inflation, but it was willing to contemplate some rise in unemployment... one Fed economist remarked to me at about that time that: ‘we can’t go out and create a recession, but we can try to take advantage of any little recessions that come along”.
In the May 1993 issue of The American Economic Review, Robert Hall from Stanford University persuasively argues for a consumption decline cause for the 1990/91 recession concluding, “...there seems to have been a cascading of negative responses during that time, perhaps set off by Iraq’s invasion of Kuwait and the resulting oil price spike in August 1990. Consumers responded to the negative forces as they would to a permanent decrease in their resources... in spite of low interest rates, firms cut all forms of investment, again as they would if there had been some permanent adverse shock (see figure 9)...The Federal Reserve reacted cautiously to the collapse of 1990. Short term interest rates fell by only a little over 100 basis points between July 1990 and January 1991.. The Fed appears to have viewed the decline in real activity as an opportunity to move to a much more aggressive anti-inflation policy. And, indeed inflation has fallen dramatically since the recession”.
What gives me the jitters is Bob Hall´s comment that “The Fed appears to have viewed the decline in real activity as an opportunity to move to a much more aggressive anti-inflation policy”.
Was that what constrained real output? (maybe by discouraging efforts to increase long-run economic capacity.) If so, it brings to mind James Meade´s 1978 Nobel Lecture where he said “Inflation targeting is dangerous”!
A decade and a half later, under Ben Bernanke, who was an IT “freak”, the Fed pursued an even more aggressive anti-inflation policy. The level of real output was further reduced and this time, its growth rate also came down. Is that related to the drop in the level of NGDP and its growth rate?
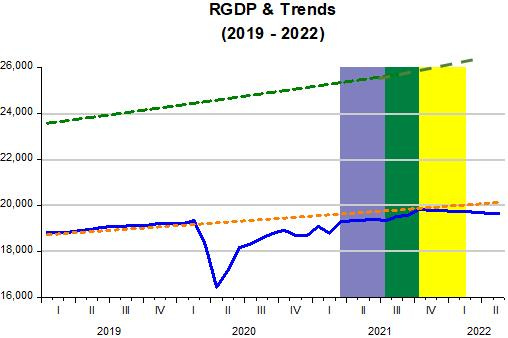
The chart below provides a useful illustration:

(Note: the blue dotted line is the pre GI trend and the green dotted line is the post 91 trend. While the blue & green lines have the same slope, indicating the same trend growth rate, the orange dotted line indicates a slower trend growth of RGDP after the GR)
Many, however, say “that´s life”. Potential RGDP fell and if the Fed tries to increase RGDP, according to NK models, inflation will rise. What´s never explained is why “potential output fell”!
I think we have the elements (or foundations) to evaluate the present time. I use monthly data for both NGDP & RGDP made available by IHS Markit.
The “photographs” below, the first two with some “photoshopping” added, will allow me to describe how the Fed can act to minimize “pain & suffering”.
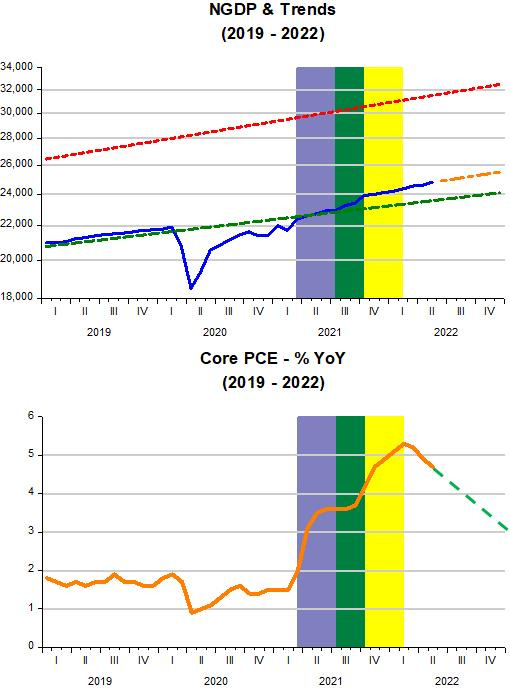
The pandemic was an unanticipated shock. Its first manifestation was a velocity- induced demand shock (when velocity tanks (or money demand skyrockets). The accompanying supply shock (initially mostly due to lockdowns) was much less acute. From the perspective of the dynamic AS/AD model, a negative demand shock can be inferred if both RGDP growth and inflation falls, and that´s what initially happened.
The Fed was quick to react, expanding broad money supply (Divisia M4) to try to offset the fall in velocity. With that, NGDP reacted positively. When aggregate nominal demand (NGDP) increased after the trough, RGDP also increased while inflation remained contained. That means that at that point there was “excess capacity” (despite the ongoing pandemic).
Inflation only begins to rise above 2% when aggregate nominal spending reaches the pre Covid target path. With NGDP at the pre Covid target level and RGDP constrained by supply, inflation increases. That´s also what´s implied by the dynamic AS/AD model in the case of a supply shock.
With that, we can infer that the blue band depicts a supply determined inflation. If the Fed, through its monetary policy, had kept NGDP evolving on trend, the increase in inflation observed in the green band would likely not have occurred. But the Fed allowed NGDP to grow. Again, according to the dynamic AS/AD model, we infer that this inflation was demand induced, since both RGDP & inflation increased.
After October 2021, however, the Fed stabilized NGDP (at a higher level). The yellow band, therefore, describes a period where supply shocks again predominate, with inflation rising and RGDP dropping.
In the last few months, following the end of the yellow band, inflation has fallen somewhat. If monetary policy leads NGDP to follow the “photoshopped” trend, implying a 5% average annualized NGDP growth, it is very likely inflation will follow the dotted down trend.
The quote from Krugman at the beginning of this post sounds right:
But if I’m right, and the markets are right, the “flation” part of that story won’t last very long. And sooner than many people believe, the Fed may find itself reversing course, trying to undo the “stag.”
The question is “how does the Fed undo the stag”. By keeping NGDP on a stable trend path, it is already doing that. I´ve shown that what ended the Great Inflation was the Fed keeping NGDP on a stable path. The level of the NGDP path was much higher than the one that prevailed before the Great Inflation. Imagine the sort of “Massive Depression” the economy would have experienced if the Fed had tried to bring the NGDP path to the original one!
The same applies now. By keeping the economy on a lower NGDP trend path since the GR, the Fed has “condemned” the economy to live, in Summers description, a “Secular Stagnation” which I prefer to call “Depressed Moderation”. The distance between the present NGDP path and the one that prevailed pre pandemic is not so big, but even so to try and bring it down would cause unnecessary pain, without any gain in inflation over time.
Furthermore, doing that would likely permanently lower the level of RGDP (which many would again just chalk to a reduction in potential output!).
As history indicates, supply constraints wane, and this one will also. Expectations of future “robust” but stable demand growth (in other words, not discouraging increases in long term economic capacity) is the “magic” the Fed can perform!