
Is the economy approaching equilibrium?
Is the economy approaching equilibrium?
I think yes, but many purveyors of doom see the opposite

“Everyone needs to understand that most of our elites, the ones who listen to Larry Summers in any event, which is all of them, have long believed that the solution to hard times is more hard times”. Catherine Johnson on Twitter @smaterparrot
The concept of equilibrium I adopt is provided by the Dynamic AS/AD model. In this model, the Aggregate Demand curve is a rectangular hyperbola. This means that along the curve NGDP (AD) growth is the same (and equals money supply (m) plus velocity (v) growth). Curves farther from the origin depict higher NGDP growth.
The chart below illustrates two equilibia. The “Great Moderation” equilibrium and the post “Great Recession” equilibrium before C-19 hit.
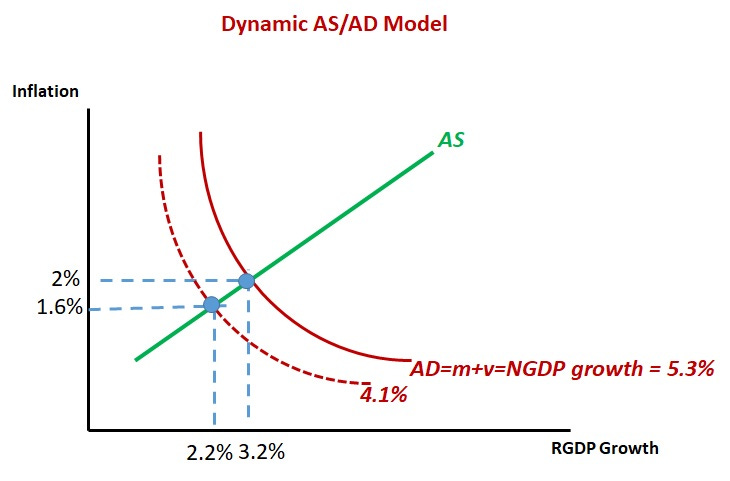
During the Great Recession equilibrium real GDP growth was lower and inflation also lower. I call it a “depressed” equilibrium which can be clearly seen in the levels chart below, where the Level of NGDP is permanently lower.

The Great Recession and its aftermath was due to Fed mismanagement, resulting in a permanently lower level and lower growth of NGDP.
The C-19 turmoil is not as easily described in one chart as in the previous case. Too many things changed simultaneously and frequently in opposite directions. It´s easier to visualize the process with “dynamic” charts covering the whole period to gauge if the economy is converging to a state of equilibrium, one in which AD (or NGDP) growth is stabilizing, inflation is converging to target and real GDP is also stabilizing.
The set of charts below try, and hopefully succeed, to do just that.
First in the series is a smoothed version of more recent (3 month annualized) NGDP growth. The amplitude of the oscillations observed is unique in history! That is “linked” to the same smoothed version of Core PCE inflation. This indicator of inflation is consistent with the Harmonized Core CPI on a non smoothed basis that leaves out the “criminal element” known as OER (Owner Equivalent Rent).
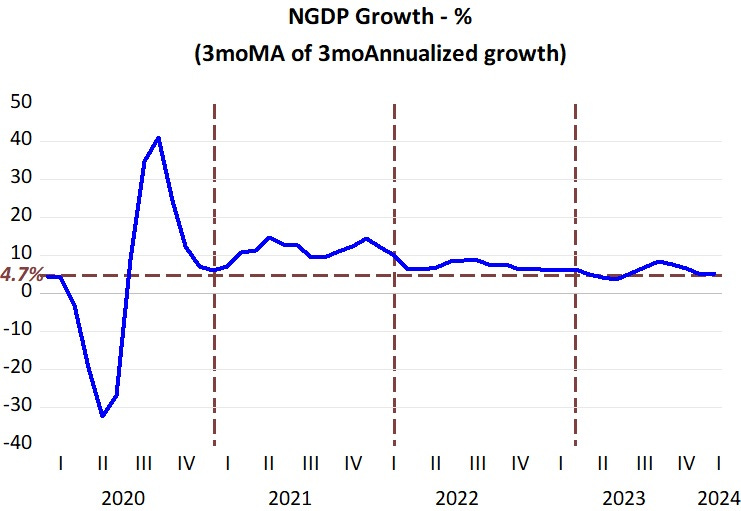


All the above are consistent with the behavior of NGDP in level terms, with NGDP growth converging on 4.7% growth, which is the average of average growth during the Great Moderation equilibrium and the average growth during the “depressed” equilibrium.
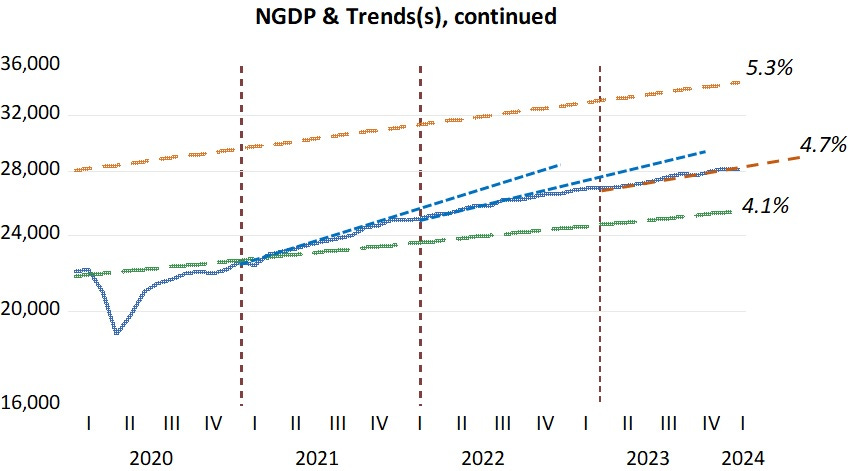
Note that the equilibrium level path (growing at 4.7%) is higher than the pre C-19 growth path. But since that was a “depressed” path, the economy is now less “depressed”. Maybe that´s the best that can be done since the “Statute of Limitations on the Great Moderation path may have expired”!
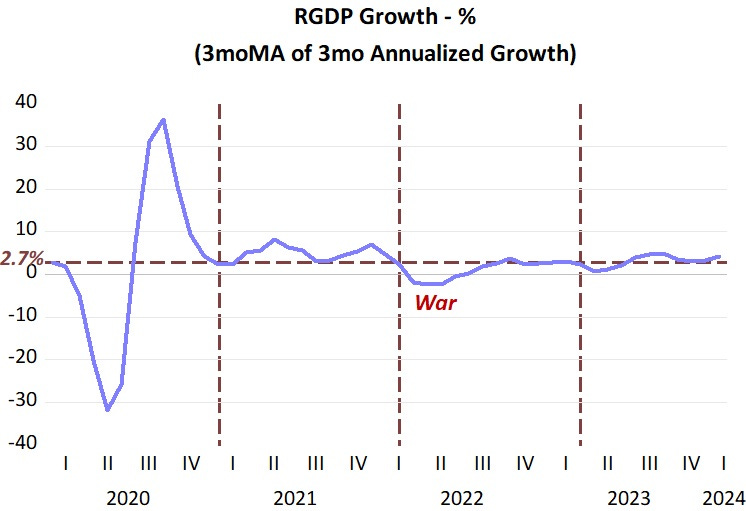
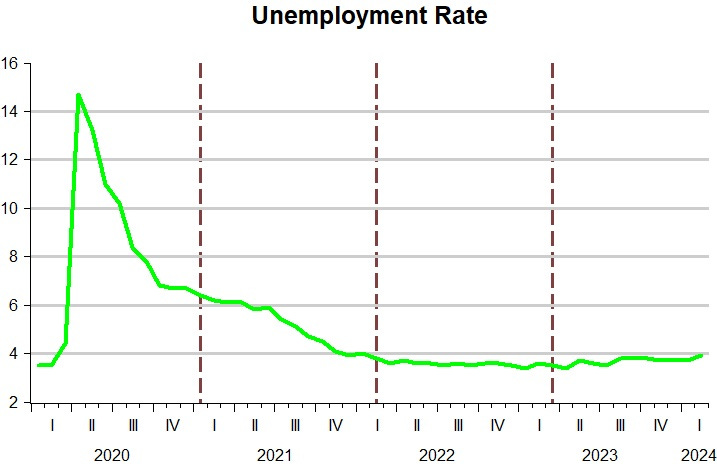
The behavior of the real economy (RGDP & Unemployment) are consistent with the behavior of the nominal economy, with RGDP growth converging on the 2.7% growth, the average of average growth during the GM equilibrium & “Depressed” equilibrium”.
It´s, as always, up to the Fed that can either listen to the “more hard time needed” crowd or to the evidence that “equilibrium” is at hand!
Agree with you tha JP & SS are wrong. On the other hand, the "pursuit of unknows" like r*, y* or u* makes for massive errors! This quote from DeLong is telling:
"I suspect that the Fed is profoundly uncomfortable with interest rates substantially above what it confidently believes the neutral rate to be, especially now that inflation is very close to its 2% target. But it will not dare to shift out of reverse until it sees signs of slower job growth."
The labor mkt is a wrong & misleading focus!
I don't follow the numerical reasoning, but I share your qualitative conclusion. We are near equilibrium. But it will be equilibrium [pace Brad DeLong] at a higher r* than previously.
I'd like to see your comments on S Sumner's "Power Is Wrong ...." over at Econlog. I think both Powell AND Sumner are wrong. :)