
Is inflation a mystery?
Is inflation a mystery?
To many it is, although also for many it shouldn´t be!

First I´ll provide some context.
In his 2017 “farewell speech”, “Monetary Policy Without a Working Theory of Inflation”, former Fed Governor Daniel Tarullo, says
In this paper, I will explain two conclusions that I drew from my experience. One is a substantive monetary policy point, and the other is more of a sociological observation relevant to the monetary policymaking process.
The substantive point is that we do not, at present, have a theory of inflation dynamics that works sufficiently well to be of use for the business of real-time monetary policy-making. The sociological point is that many (though certainly not all) good monetary policymakers who were formally trained as such have an almost instinctual attachment to some of those problematic concepts and hard-to estimate variables. [the “star” variables]
Two years later, in 2019, Robert Barro wrote “Mysteries of Monetary Policy”. The intro:
Since the federal funds rate peaked at 22% in the early 1980s, inflation in the United States has remained low and stable, leading many to believe that the mere threat of renewed interest-rate hikes has kept it in check. But no one really knows why inflation has been subdued for so long.
And concludes:
This makes me wish that I had a better understanding of monetary policy and inflation. It also makes me wish that the people responsible for monetary policy had a better understanding than I have. Many readers, no doubt, would say that my second wish has already been granted. Let us hope they are right.
To “top it off”, there´s the famous Powell quip in the 2022 ECB Forum on Central Banking:
“We now understand better how little we understand about inflation”.
San Fran Fed president Mary Daly in Feb 21:
"I am not thinking that we have unwanted inflation around the corner," Daly said at a virtual event held by the University of San Francisco. "I don't think that's a risk we should think about right now."
Oh, the irony of it all.

In March 23
“It’s clear there is more work to do,” Daly said in a speech at Princeton University. “In order to put this episode of high inflation behind us, further policy tightening, maintained for a longer time, will likely be necessary.”
In a speech on March 3, Harkin ends his speech on “What´s keeping inflation elevated?” “beautifully”:
We would all like inflation to fall quickly back to target. I am confident it will in time but doubtful the process will be quick. But I should close by reminding you that inflation doesn’t come from statisticians but from the sum of individual actions. (So, if any of you in the audience have a price increase in the works, feel free to help us all out by backing off.)
So, maybe even Powell´s quip is too optimistic!
A few weeks ago, Mishkin et al presented a paper “Managing Disinflations”. The abstract reads:
What do history and a simple model teach us about the prospects for central bank efforts to lower inflation to target from recent multi-decade highs? To answer this question, we start by analyzing the large disinflations that occurred since 1950 in the United States and several other major economies. Then, we estimate and simulate a standard model over several time periods, using various linear and nonlinear measures of labor market slack.
We draw three main lessons from the analysis: (1) there is no post-1950 precedent for a sizable central-bank-induced disinflation that does not entail substantial economic sacrifice or recession; (2) regardless of the Phillips curve specification, models estimated over a historical period that includes episodes of high and variable inflation do a better job of predicting the post-pandemic inflation surge than those estimated over the stable inflation period from 1985 to 2019; and (3) simulations of our baseline model suggest that the Fed will need to tighten policy significantly further to achieve its inflation objective by the end of 2025. Going forward, our analysis supports a return to a strategy of preemptive policy.
Very interestingly, in the August 5 2008 FOMC meeting, Mishkin´s last, the inflation worry was alive and well, maybe more so than ever! In his farewell speech Mishkin says:
First of all, let me talk about the issue of focusing too much on the federal funds rate as indicating the stance of monetary policy. This is something that’s very dear to my heart. I have a chapter in my textbook that deals with this whole issue and talks about the very deep mistakes that have been made in monetary policy because of exactly that focus on the short-term interest rate as indicating the stance of monetary policy.
Also, as Bernanke (a good friend and occasional co-author with Mishkin) channeling Milton Friedman once said:
As emphasized by Friedman (in his eleventh proposition) and by Allan Meltzer, nominal interest rates are not good indicators of the stance of policy, as a high nominal interest rate can indicate either monetary tightness or ease, depending on the state of inflation expectations. Indeed, confusing low nominal interest rates with monetary ease was the source of major problems in the 1930s, and it has perhaps been a problem in Japan in recent years as well. The real short-term interest rate, another candidate measure of policy stance, is also imperfect, because it mixes monetary and real influences, such as the rate of productivity growth…
The absence of a clear and straightforward measure of monetary ease or tightness is a major problem in practice. How can we know, for example, whether policy is “neutral” or excessively “activist”?
Ultimately, it appears, one can check to see if an economy has a stable monetary background only by looking at macroeconomic indicators such as nominal GDP growth and inflation…”
[Note: Unfortunately, in 2008, he preferred to concentrate on inflation, and worse, the headline variety, which was being buffeted by the oil and commodity price shocks! As indicated by the Dynamic AS/AD (DASAD) model, inflation is not always a good indicator of the stance of monetary policy.]
On this topic, many years ago Nick Rowe did a lovely post “explaining” why he switched from being an inflation targeting fan to being a NGDP Level target proponent:
In brief, it's because deviations of inflation from target, or deviations of the price level from the implied target, were the guard dogs that didn't bark right when we needed them to bark. And deviations of NGDP from the implied target was a guard dog that barked loud and clear.
These are the images that illustrate Nick´s reasoning for Canada (note that the headline CPI even “barked up the wrong tree”).
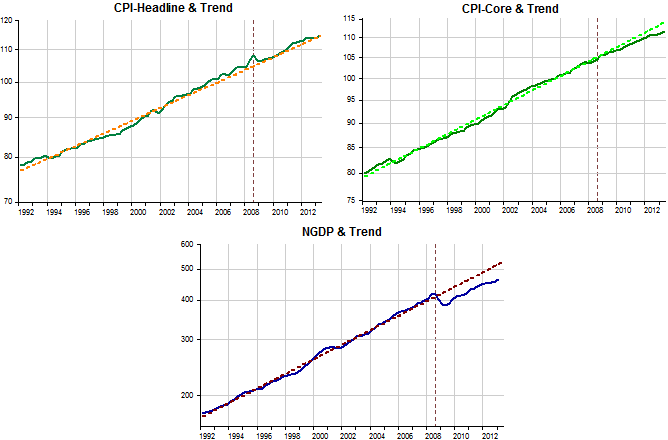
The inflation chart below illustrates the “mystery” to be solved. The bars identify “strategic” moments in the process (April 20, Feb 21 & Feb 22), those that need to be explained to pierce through the fog that shrouds the “inflation mystery”.

Below the charts depicting the behavior of Aggregate Nominal Spending (NGDP) and real output (RGDP) in level terms.

What´s the correspondence between the inflation chart and the spending and output charts? When the pandemic hit, both spending and output “dive”, so inflation has nowhere to go but down (in spite of lockdowns and other supply-restraining forces).
Between the two first bars, spending and output recover, so inflation slowly rises back to “target”. Why spending and output recover will become clear in a while.
By February 2021, spending has gone back to the post Great Recession trend level, but output remains a bit below. This can be explained by supply constraints from C-19. Inflation, however, remains below target (no supply shock inflation)
From that point, spending rises above trend (a demand shock). As spending climbs, so does inflation. Since real output also rises, despite supply constraints, part of the rise in inflation may be due to supply issues.
After Feb 22, spending continues to rise, albeit at a slower rate. The “war shock” that takes place at that time reduces real output, but core PCE inflation stops rising and begins to slowly fall.
Many argue that the inflation experienced after Feb 21, is mostly due to supply shocks and that restraining aggregate demand is not warranted. In my view, supply shocks play at most a supporting role to the inflation observed, which is mostly the result of excessive demand growth.
Now for the explanation of the patterns observed in spending and output, which will also explain the pattern observed for inflation, “solving the mystery”.
The charts below show the “thermostat” at work. A well-functioning thermostat will adequately offset changes in the “outside temperature” so as to keep the “inside temperature” stable. In our case, the “outside temperature” is represented by the velocity of money (V) (the inverse of money demand). As Friedman wrote in 1971, V can be “whatever people want”. The “inside temperature” is represented by nominal aggregate spending (NGDP). The “thermostat” is the money supply which has to vary to offset changes in V in order to keep changes in spending stable.
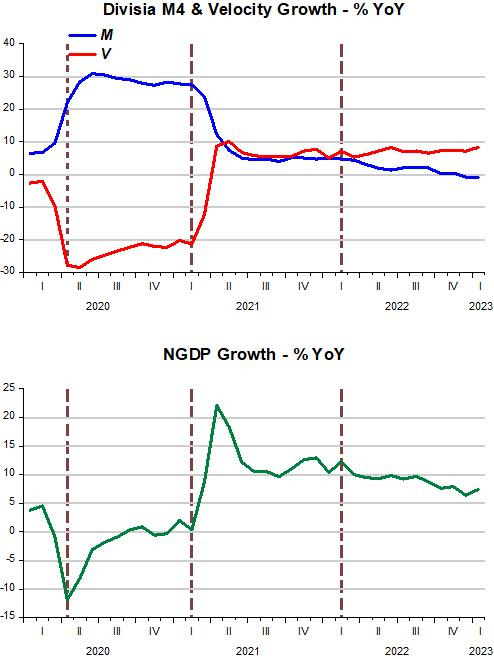
Initially, velocity fell substantially more than money supply increased, so NGDP growth tanks. After April 20, velocity rises while money supply growth remains relatively stable, allowing an increase in the “inside temperature” (NGDP growth).
After Feb 21, while velocity increases robustly, money supply falls by much less, so NGDP growth skyrockets, pulling inflation up with it. After the initial increase, velocity growth “stabilizes” and so does money supply growth bringing down the growth of NGDP to a still high but relatively stable rate.
After Feb 22, while velocity growth remains stable, money supply growth shows a declining trend, which is mirrored in the slowly declining growth in spending and reflected in the slow decline in inflation.
Since money supply growth has turned negative, traditional monetarists predict a recession in the wings. But with velocity growth positive and relatively stable, money supply growth has be be even more negative to bring spending growth to the 4%-5% rate that would be consistent with nominal stability.
Many analysts, for example, emphasize that the change in the composition of spending from services to goods brought about by the pandemic led to supply-chain issues with consequences for inflation.
The chart below shows the differing behavior of spending on goods and services.

So what? These shifts have no independent bearing on inflation, which was “fully explained” above.
If we look at inflation and freight rates, affected by supply chain issues resulting from changes in demand composition, that becomes clear.

When goods spending rises quickly after C-19 hit, freight rates double, while inflation rises slowly back to target, guided by the workings of the “thermostat”.
With aggregate spending rising robustly after Feb 21, spending on goods also jumps and freight rates double again.
What happens over the past 12 months is key. While goods demand does not increase at all, supply chains issues are resolved and freight rates plummet. Inflation, however, decreases slowly for the reasons we argued before.
Bottom line: If only the Fed stopped worrying about low unemployment (and trying to increase that rate), and concentrated on working to achieve nominal stability, the future would look much more pleasant!
Banks don't lend deposits. Deposits are the result of lending.
Revisit Richard Werner:
https://www.youtube.com/watch?v=EC0G7pY4wRE
Take the “Marshmallow Test”: (1) banks create new money (macro-economics), and incongruously (2) banks loan out the savings that are placed with them (micro-economics).
As Luca Pacioli, a Renaissance man, "The Father of Accounting and Bookkeeping” famously quipped: “debits on the left and credits on the right, don’t go to sleep with an imbalance”.
You have to retain cognitive dissonance capacity, like Walter Isaacson described Albert Einstein’s ability: to hold two thoughts in your mind simultaneously – “to be puzzled when they conflicted, and to marvel when he could smell an underlying unity”.
It’s also like Athenian philosopher Plato -- whose "first fruits of his youth infused with hard work and love of study" said:
"We seem to find that the ideal of knowledge is irreconcilable with experience”.
In "The General Theory of Employment, Interest and Money", pg. 81 (New York: Harcourt, Brace and Co.): John Maynard Keynes gives the impression that a commercial bank is an intermediary type of financial institution (non-bank), serving to join the saver with the borrower when he states that it is an:
“optical illusion” to assume that “a depositor and his bank can somehow contrive between them to perform an operation by which savings can disappear into the banking system so that they are lost to investment, or, contrariwise, that the banking system can make it possible for investment to occur, to which no savings corresponds.”
In almost every instance in which Keynes wrote the term "bank" in his General Theory, it is necessary to substitute the term non-bank in order to make Keynes’ statement correct.
This is the source of the pervasive error that characterizes the Keynesian economics, the Gurley-Shaw thesis, the elimination of Reg Q ceilings, the DIDMCA of March 31st, 1980, the Garn-St. Germain Depository Institutions Act of 1982, the Financial Services Regulatory Relief Act of 2006, the Emergency Economic Stabilization Act of 2008, sec. 128. “acceleration of the effective date for payment of interest on reserves”, etc.
This is both the source of stagflation and Secular Strangulation, not robotics, not demographics, not globalization.