
How can you talk coherently about inflation?
How can you talk coherently about inflation?
The answer: It´s not easy!!

When inflation flipped above the 2% target in April 2021, the world went “crazy”. “Teams” were formed as in “Team Temporary” and “Team Persistent”. At the close of the year, a bombshell in The Guardian: “We have a powerful weapon to fight inflation: price controls. It’s time we consider it”.
This gave rise to many posts and tweets, both in favor and against. Two very good explainers are Joseph Politano´s “Are Rising Corporate Profit Margins Causing Inflation? A Response to People Calling for Antitrust Actions and Price Controls to Combat Inflation” and Noah Smith´s “Why price controls are a bad tool for fighting inflation?”
For a good summary of the “discussion”, I recommend Adam Tooze´s “Inflation & Price Controls” (an encore to that post is here).
Price (& wage) controls is an ancient strategy to “tame” inflation. Maybe the earliest account comes from more than 2 millennia ago, when the Roman emperor Diocletian tried wage and price controls in an effort to right the market after earlier price controls had failed. In the fourth century B.C., the Roman government bought corn and, in times of shortage, re-sold it at a low fixed price.
In Brazil, where I come from, the 1980s and early 90s witnessed a succession of price controls (PC) (in the extreme, price freezes and financial assets confiscation). The chart below shows monthly rates of inflation.
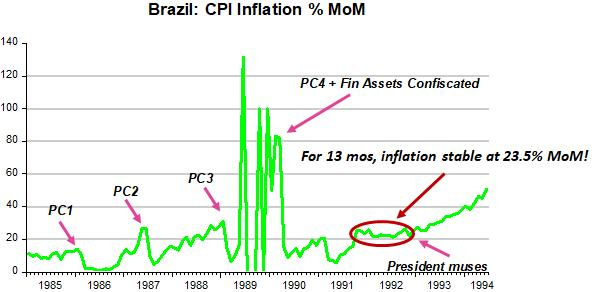
Instances of price controls/freezes are indicated. Note that while the first is “effective” for a few months, subsequent ones lose “effectiveness” very quickly. In addition, inflation rebounds more strongly after each try!
Interestingly, for 13 months from late 92 to late 93, inflation is stable at 23.5% a month on average! This “illusion” ends when the new President muses that his “mother is unable to afford needed medicines”. That was interpreted by economic agents as a sign that new price controls would be implemented, so everyone began to increase their price before the event.
In some sense, it could be said that price controls, instead of taming inflation, are a reason for its subsequent increase!
The next chart depicts the price level and shows when inflation/hyperinflation ended after mid-94. The plan that ended inflation was ingenious (story for another time). It is, however, important to note that there were no price controls involved.
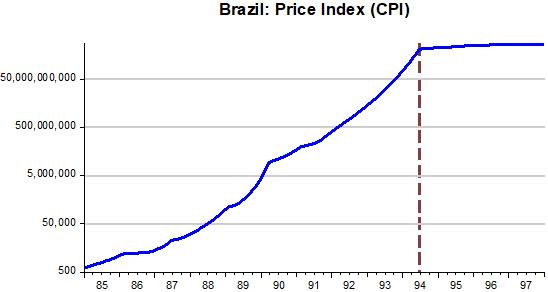
(Note: If you look at Thomas Sargent´s End of Four Big Inflations, you´ll note that all price level charts are qualitatively identical to the chart above).
One impediment to talk coherently about inflation is a generalized misunderstanding of what inflation is. The most general definition of inflation says it is “a sustained increase in the general level of prices”. Maybe understandably, many think that inflation is a “price phenomenon”.
An analogy may clarify. Just as the warmth provided by the flames in a fireplace, to be sustained, has to be regularly stoked by throwing logs into the fireplace, for the flames of inflation to be sustained it also has to be regularly stoked, not by throwing logs, but by conducting monetary policy in in a way that is consistent with maintaining the inflation flame alive.
In that sense, inflation is “always and everywhere a monetary (policy) phenomenon”.
The question then is: What best defines the stance of monetary policy? The popular view is that interest rates define the stance of monetary policy. For example, the Minutes of the December FOMC Meeting released yesterday indicate that clearly:
Discussion of Policy Normalization Considerations
Participants began a discussion of a range of topics associated with the eventual normalization of the stance of monetary policy.
Participants noted that, given their individual outlooks for the economy, the labor market, and inflation, it may become warranted to increase the federal funds rate sooner or at a faster pace than participants had earlier anticipated.
In “A Monetary Theory of Nominal Income”, published more than 50 years ago, Milton Friedman writes:
"[I]n particular, the approach provides an interpretation of the empirical generalization that high interest rates mean that money has been easy, in the sense of increasing rapidly, and low interest rates, that money has been tight, in the sense of increasing slowly, rather than the reverse.
It must be noted that money growth is not an absolute measure, but has to be looked at as “relative to money demand”. This becomes clear when Friedman writes:
For monetary theory, the key question is the process of adjustment to a discrepancy between the quantity of money demanded and the nominal quantity supplied. Such a discrepancy could arise from either a change in the supply of money (a shift in the supply function) or a change in the demand for money (a shift in the demand function).
The key insight of the quantity-theory approach is that such a discrepancy will be manifested primarily in attempted spending, thence in the rate of change of nominal income (NGDP).
Put differently, money holders cannot determine the nominal quantity of money, but they can make velocity anything they wish (Note, for example, the sudden and deep fall in velocity when the Covid19 pandemic hit)
What, on this view, will cause the rate of change in nominal income [NGDP] to depart from its permanent value? (Note: interpret “permanent value” as a stable growth path of NGDP). Anything that produces a discrepancy between the growth in the quantity of money demanded (inverse of velocity) and the quantity supplied.
A little over three decades later, consistent with his Monetary Theory of Nominal Income, Friedman gave a “Thermostat” interpretation to good monetary policy.
A few preliminaries: In a home, for example, the thermostat is the mechanism that offsets changes in the outside temperature in order to maintain the inside temperature constant (or stable). In the monetary policy analogy, the thermostat is the Fed´s close control of the money supply working to offset changes in velocity (the inverse of money demand or the “outside temperature”) to maintain NGDP (“inside temperature”) on a stable growth path.
More than a decade ago, Nick Rowe gave the perfect interpretation of Milton Friedman´s Thermostat Analogy:
Milton Friedman's Thermostat
If a house has a good thermostat, we should observe a strong negative correlation between the amount of oil burned in the furnace (M), and the outside temperature (V). But we should observe no correlation between the amount of oil burned in the furnace (M) and the inside temperature (P [or NGDP]). And we should observe no correlation between the outside temperature (V) and the inside temperature (NGDP).
An econometrician, observing the data, concludes that the amount of oil burned (M) had no effect on the inside temperature (NGDP). The only effect of burning oil seemed to be that it reduced the outside temperature. An increase in M will cause a decline in V, and have no effect on NGDP.
A second econometrician, observing the same data, concludes that causality runs in the opposite direction. The only effect of an increase in outside temperature (V) is to reduce the amount of oil burned (M). An increase in V will cause a decline in M, and have no effect on NGDP.
But both agree that M and V are irrelevant for NGDP. They switch off the furnace, and stop wasting their money on oil. [End the Fed?]
An example of the “first econometrician” is this take from Krugman:
And while it took a while, my sense is that by 2014 or so the great majority of economic commentators had accepted that looking at the money supply in the U.S. context offered basically no information about future inflation.[or nominal GDP]
My conclusion is that the best gauge of the stance of monetary policy is given by the behavior of NGDP growth. The stance is “neutral” if NGDP growth is stable. The stance is “expansionary” if NGDP growth is rising, and “contractionary” if NGDP growth is falling (or even negative).
The stance of monetary policy can also be “erratic”. This happens when NGDP growth shows ample high frequency swings.
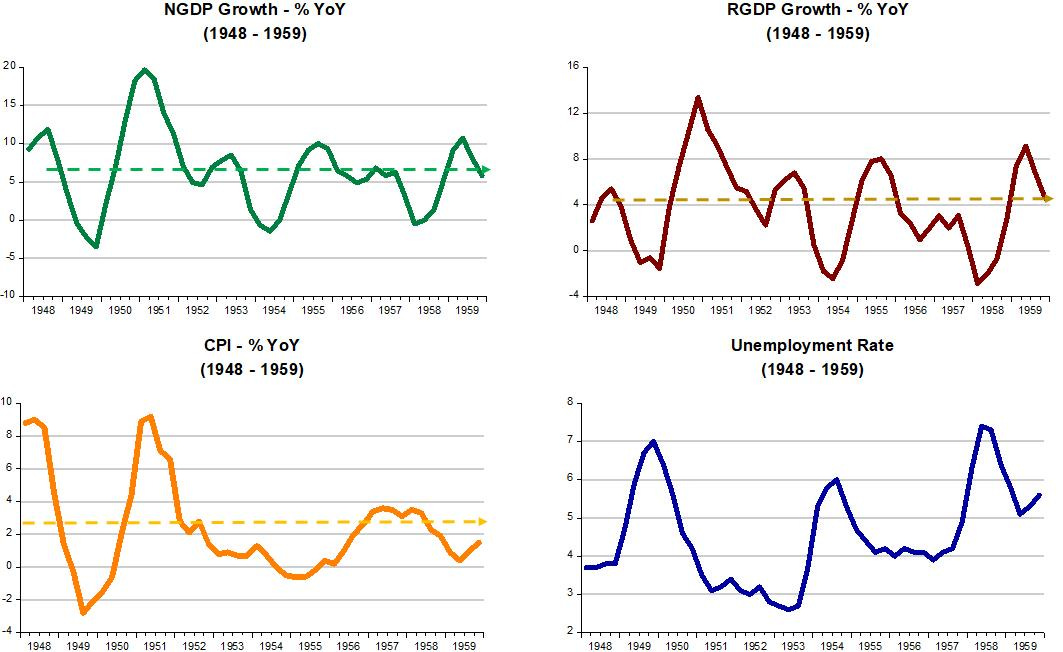
The charts below “identify” the stance of monetary policy from the perspective of NGDP growth during different periods. I also show the behavior of important macro variables - real growth, inflation and unemployment - associated with the particular stance of policy.
The post war years are characterized by an “erratic” stance of policy, with ample high frequency swings, but no trend. This pattern is reflected in the variables of interest. Note that “high” inflation is always “temporary” under this monetary policy stance.
The 1960s is a “teachable” moment. In the first few years of the decade the stance of policy remained “erratic”, but inflation remained surprisingly low and stable. Soon, however an “erratic upward trend”, or an “expansionary” monetary policy stance became clear. With the last burst of NGDP growth, we observe a burst in real growth and a drop in unemployment. Inflation, however takes off, after which real growth plummets and unemployment stops falling.
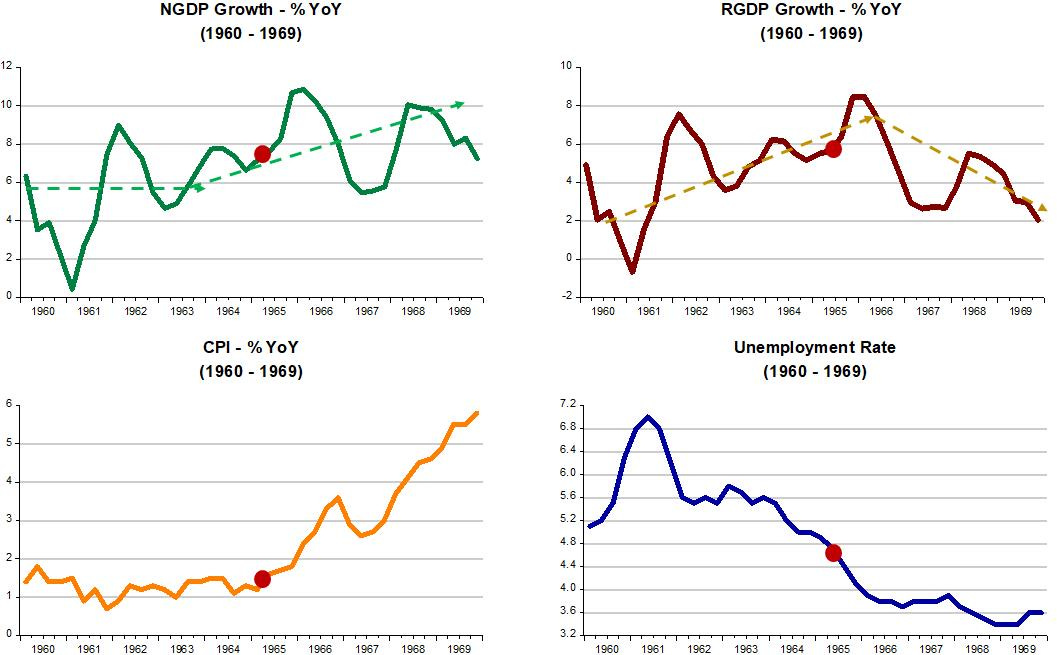
One of the bad ideas that came out of this decade, was the belief that “too low” unemployment was a harbinger for rising inflation (the Phillips Curve mentality). That only serves to distract from the fact that the real culprit for the rising inflation observed was the Fed´s consistently expansionary monetary policy!
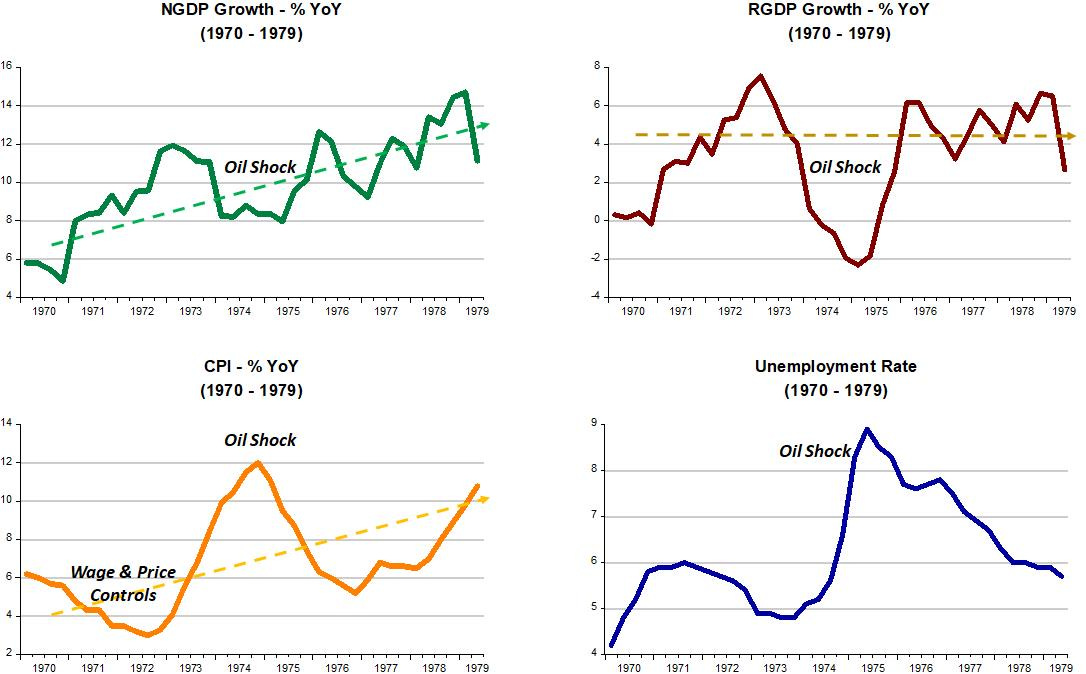
The 1970s is just a consolidation of Fed´s expansionary stance for monetary policy from the previous decade (which became even more expansionary). The resulting inflation trend is impacted by factors such as the wage/price controls of 1971/72 and the oil shock of 1973/74. Despite the expansionary stance of monetary policy implied by the rising trend of NGDP growth, real growth remains trendless (but volatile). This is an implication of the long-run neutrality of money.
And at the close of the 1970s, Volcker took over at the Fed and things changed. In his first Federal Open Market Committee (FOMC) meeting as chairman of the Federal Reserve Volcker “defined his moment” saying:
“Economic policy has a kind of crisis of credibility. As a result, dramatic action to combat inflation would not receive public support without more of a crisis atmosphere”.
Inflation and inflation expectations had become entrenched over the previous 15 years (a “crisis of credibility”). The stance of monetary policy under Volcker was also “erratic”, but this time in a tightening direction.
The panel gives an overview of the period. The dots mark the point when things broke, or when expectations for the future changed dramatically!
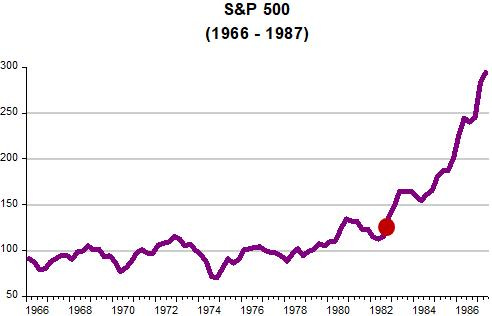
The stock market tells an interesting story. From the mid-60s, when inflation took off, the stock market (S&P 500) had remained “dormant” (in real terms it fell significantly). When “views of the future brightened”, it took off, rising by a factor of 3 in a little over four years!
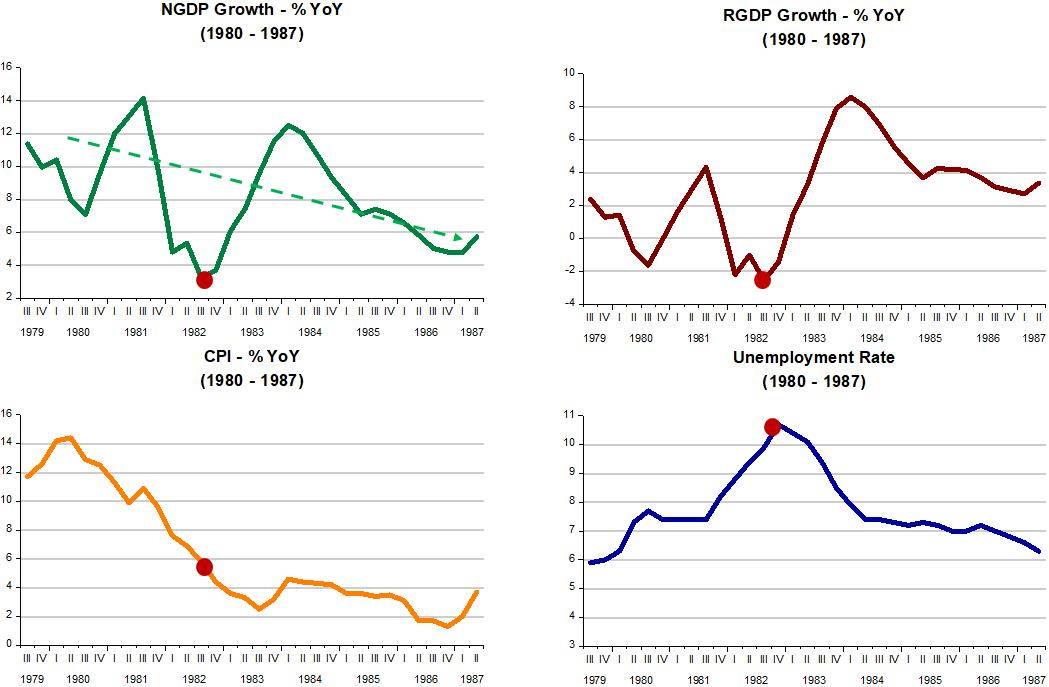
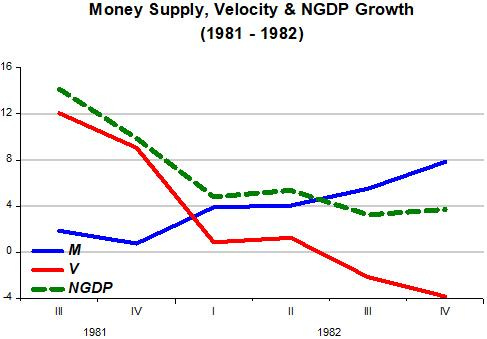
Volcker engineered his “crisis atmosphere” with a very tight monetary policy, resulting in the deep recession of 1981-82. Our thermostat Analogy makes this clear.
When velocity (the “outside temperature”) fell significantly, the Fed did not allow the money supply to rise by any measure close to offset the fall. The result was a big drop in NGDP growth (“inside temperature”).
The panel below shows the outcome of Volcker´s “crisis atmosphere”. It is important to note, contrary to “conventional” views, that inflation did not fall because unemployment rose. Both are the consequence of the tight monetary policy adopted by the Volcker Fed, just as the big drop in real growth.
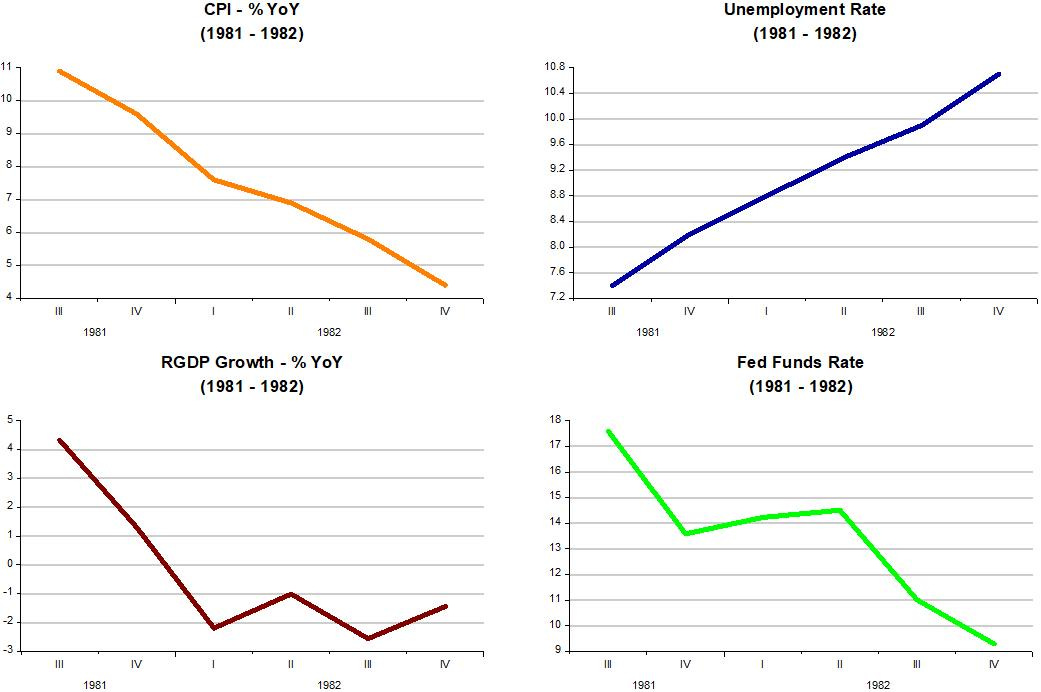
Now, according to the view that “interest rates define the stance of monetary policy”, monetary policy was being eased throughout this period! But we´ve learned that “low (falling) rates indicate that monetary policy has been tight (tightening)”.
However, by keeping the “faith” that interest rates define the stance of monetary policy, it has become conventional to say that there are lags in the effect of monetary policy. In that case, the subsequent real growth and fall in unemployment are the result of the previous drop in rates!
With the Volcker Adjustment complete, we enter the era that became known as the “Great Moderation” that extends for the next 20 years.
The scale of the charts are the same as the ones obtained during the Volcker Adjustment. The reason is to allow easy comparison of magnitudes and volatility of the different variables. I have changed the inflation variable from the CPI to the Trimmed Mean PCE, also called “super core” PCE, which is obtained from discarding (trimming) from the index the most extreme observations from both sides of the spectrum.
The notable characteristic of the period is the relative stability of the variables, in particular the stability of NGDP growth (implied by the good functioning of the thermostat). It appears that striving for nominal stability (stable NGDP growth) is a worthy objective for the Fed!
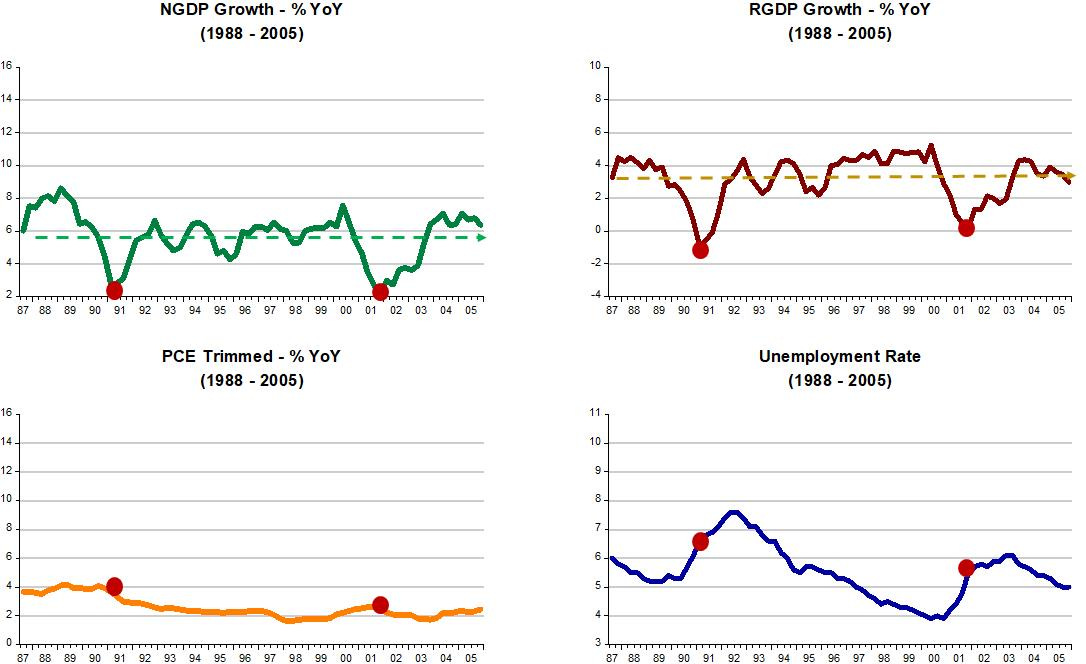
There were, as indicated by the dots, periods when the Fed “failed”. The first came to be called “strategic disinflation”, after which, inflation was permanently reduced, remaining stable and close to 2%. Note the sensitivity of the unemployment rate to reductions in nominal spending (NGDP) growth.
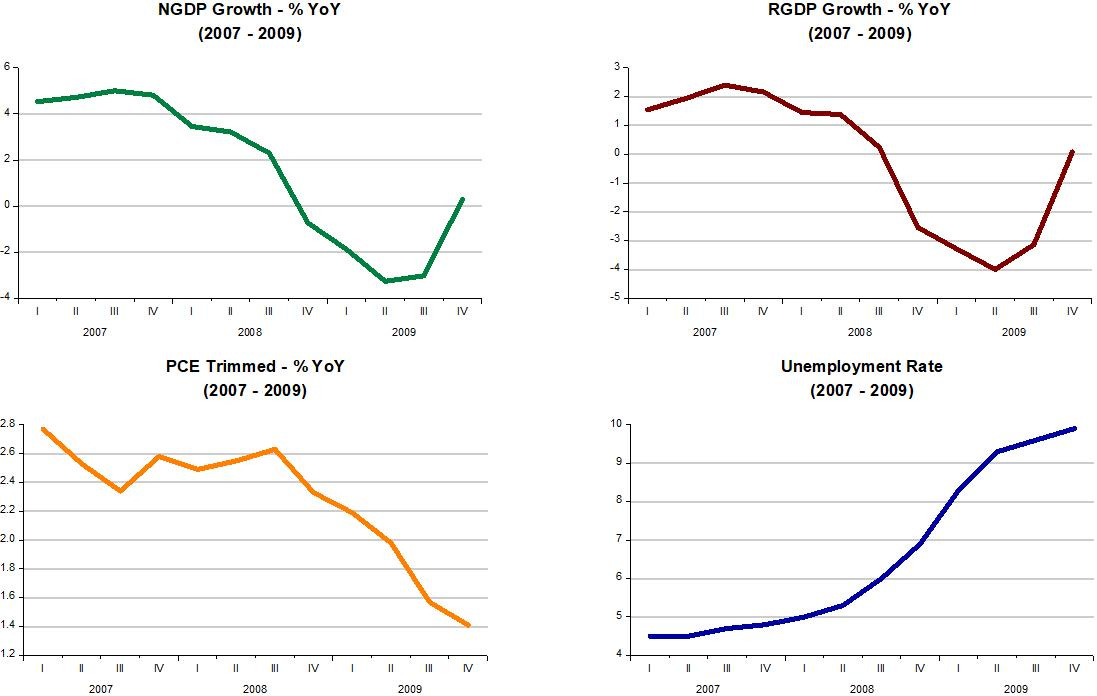
Then we get to the moment that the Bernanke Fed failed miserably (with the charts having their own scale, not tied to the scales obtained during the Volcker Adjustment). Monetary policy was “crunched” (with the Fed mostly “afraid” of the risk to (headline) inflation from oil shocks). The effects of the Fed tightening on inflation, unemployment and real growth were significant, and strongly so.
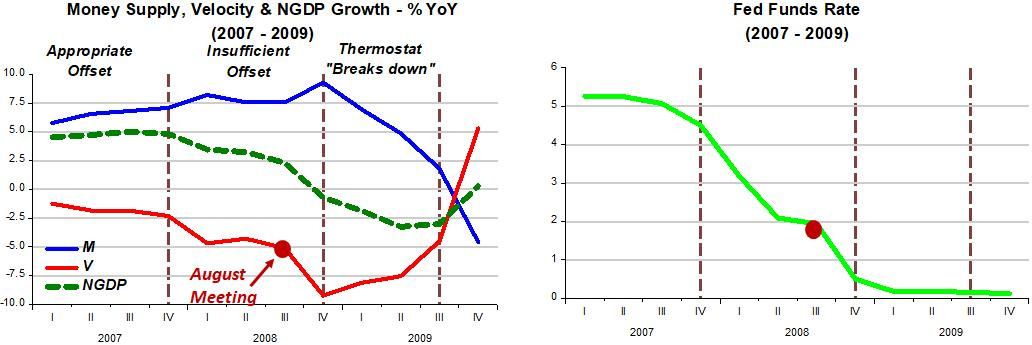
The “Thermostat Analogy” chart below clearly indicates that, even before “breaking down”, the thermostat was not working well, with monetary policy being tightened. However, according to the interest rate view, monetary policy was “accommodative”!
A good example for the Fed´s mindset can be gleaned from the Statement in the August 2008 meeting, where we read:
Economic activity expanded in the second quarter, partly reflecting growth in consumer spending and exports. However, labor markets have softened further and financial markets remain under considerable stress. Tight credit conditions, the ongoing housing contraction, and elevated energy prices are likely to weigh on economic growth over the next few quarters.
Over time, the substantial easing of monetary policy, combined with ongoing measures to foster market liquidity, should help to promote moderate economic growth.
Over the next several months nothing of the sort happened. In fact, soon after, the thermostat “broke down” and growth, unemployment and inflation (relative to target) did much worse! But if you look at the FF rate, the Fed was doing all it could!
In the second half of 2009, things began to turn around, not because interest rates were kept at “zero”, but because the thermostat was controlled so as to allow some of the rise in the “external temperature” (Velocity) “slip” inside to warm up the “internal temperature” (NGDP growth).
Unfortunately, the Fed decided that the best decision was to cut the recovery short and allow the economy to evolve along a lower level growth path.
This is made clear when we look at the level charts for NGDP and RGDP.
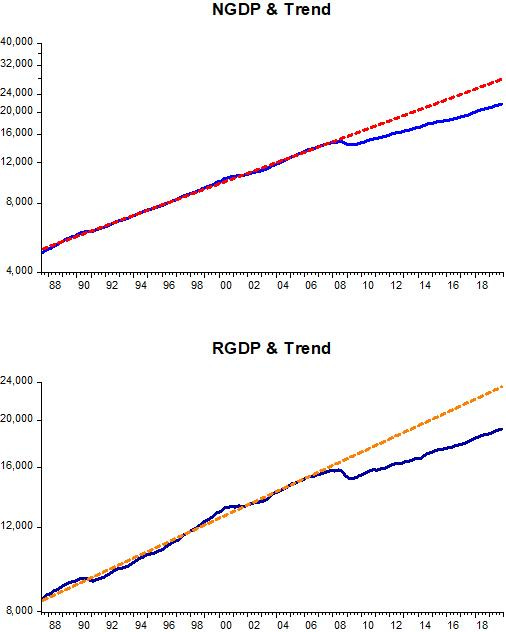
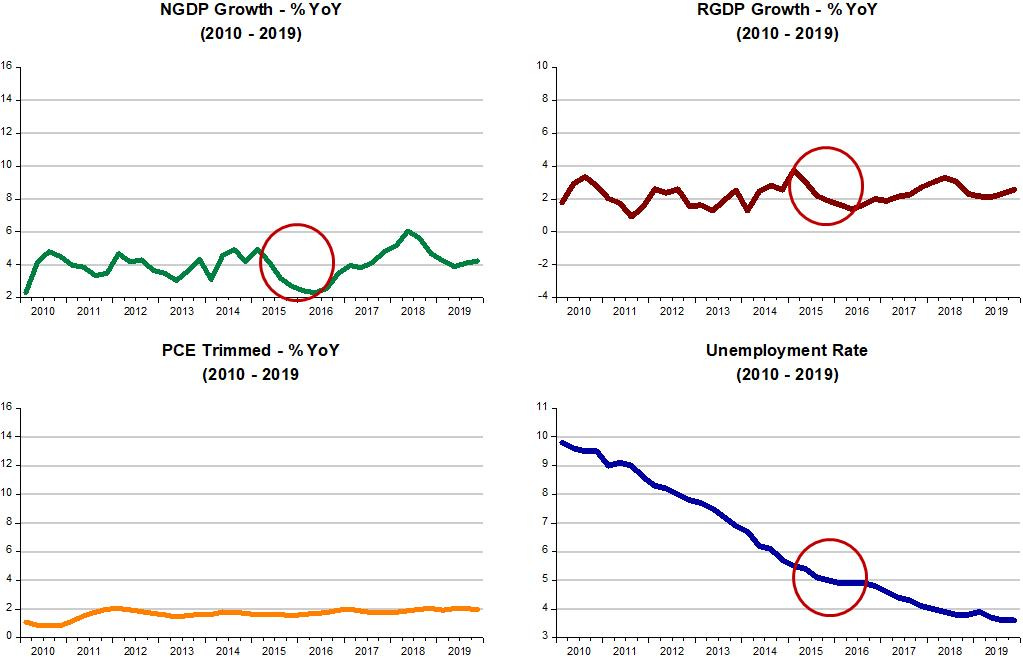
In practice, the Fed set the thermostat to keep the “inside temperature” (NGDP growth) at a stable but “cooler” level. For example, while during the Great Moderation the “inside temperature” (NGDP growth) ran at 5.4%, post Great Recession, this was only 4%. Real Growth was also “cooler” and the labor market (unemployment) “heated up” at a slow pace. Inflation was slightly “cooler” also. This is illustrated below, where the circles indicate moments when the Fed was not “dialing” the thermostat very precisely, letting the “inside temperature” fall a little too much. Real growth also falters and the unemployment rate stops falling temporarily.
In early 2020, Covid19 hit and “mayhem” ensued. Given the relatively short period for analysis, I use level charts for NGDP and RGDP. Covid19 was both a demand shock (from the quick & deep fall in velocity) and a supply shock (lockdowns). The demand shock was stronger than the supply shock initially, given that some measures of inflation and real output fell.
This time around, the Fed did not hesitate. It quickly “pounced” on the thermostat to increase the “inside temperature” (NGDP) to its previous “normal” value (trend). This shows how the Fed messed up in 2009 when, in much more favorable conditions, it decide a lower “temperature” was the way to go forward!
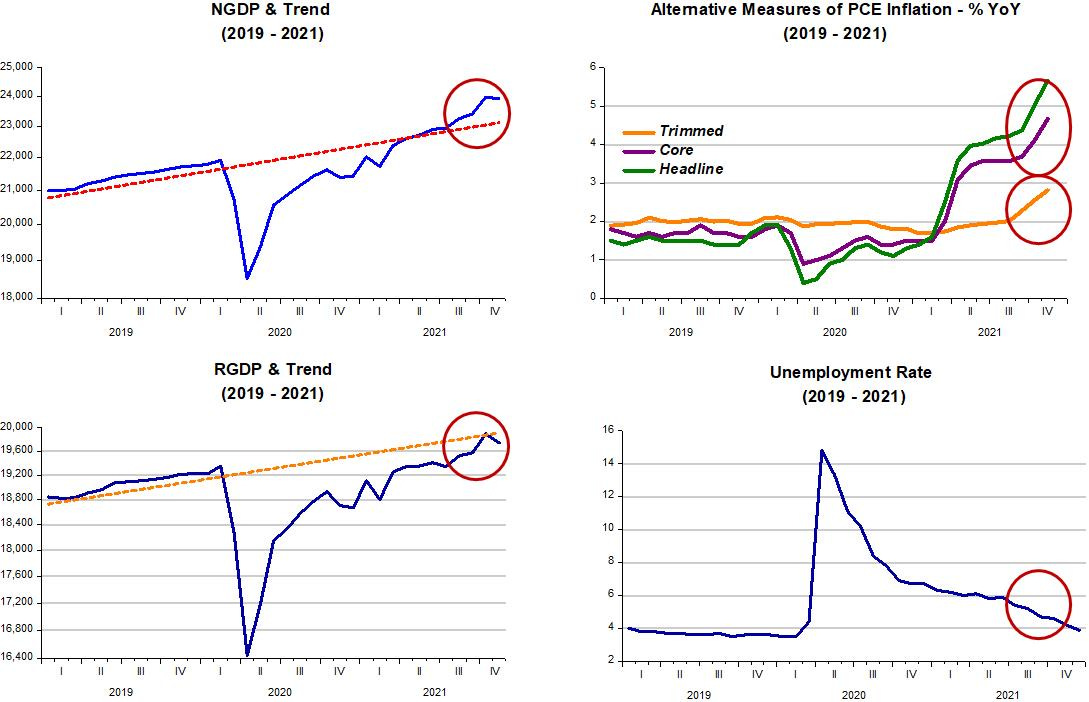
The circles indicate that, when the Fed realized that even after having brought the “inside temperature” back to its “normal” level, real output was still below its own “normal” level, it continued to dial-up the thermostat.
With that, the “internal temperature level (NGDP) increased, bringing RGDP back to the post GR trend. In other words, a full recovery 18 months after the April 2020 trough.
Supply constraints did not block the recovery but were sufficiently binding to push inflation higher. The increase in NGDP also allowed for a stronger fall in the unemployment rate. Again, it is important to note that the fall in unemployment was not responsible for the increase in inflation. Both are the outcome of the Fed´s policy to “warm” the economy sufficiently to allow a full recovery in an environment still entangled with supply constraints.
Will inflation keep rising? We know (from everything I showed), that inflation can only be ongoing if the Fed keeps “fanning the flames”. If, from this point on, it manages the thermostat so as to keep NGDP growing close to the 4% trend that began in 2010, inflation will not go on rising. The level of inflation will be more or less persistent depending on the persistence of supply bottlenecks, which depend on the ability to bring the pandemic under control. This, in turn, is closely associated with the spread of vaccines!
One takeaway is that interest rates are a bad/misleading guide to the stance of monetary policy. Like we observed last week, talk about “hawkish” turns in Fed communication only serve to increase market volatility. Another is that talk about inflation is not productive (and inflation targeting regimes, even if of the average variety, are not robust).
If you have come this far and found the content mildly interesting or useful, please subscribe. If you are already one, maybe you will think of sharing with friends and acquaintances. Thank you
re: "With the Volcker Adjustment complete, we enter the era that became known as the “Great Moderation” that extends for the next 20 years."
The "Great Moderation" was due the impoundment and ensconcing of monetary savings, income not spent. As the absolute volume and percentage of bank-held savings grew, velocity fell (as predicted). The error here is that banks are not financial intermediaries serving to join savers and borrowers. Every time a DFI makes a loan to, or buys securities from, the non-bank public, it creates new money - demand deposits, somewhere in the system. I.e., all deposits are the result of lending and not the other way around.
The reason people talk about inflation is because it’s what the Fed targets, and that matters. They went to great lengths to design and roll out FAIT- they should stick to it. What kind of insane central bank would devise a target and almost immediately abandon it?
You might prefer a NGDP target but before they could commit to that they need credibility. To have credibility they need to not immediately lie to us.