
"Hopium"
"Hopium"
"hope" and "opium": used to describe a fictional drug to help one stay hopeful in times of stress.

On Twitter (X), Michael A. Arouet @MichaelAArouet writes:
Isn’t it cute to see a forecast which assumes that for the first time in six decades unemployment rate will stay at extremely low level for few years and won’t spike higher as it always does?
And puts up this chart from Golman Sachs (GS).

concluding: “Hopium till the last moment”.
Arouet puts forth a non argument, asking “…and won’t spike higher as it always does?”
The thing to do is try to explain the pattern observed, where when unemployment falls to a “low” (not always) level, it quickly spikes (with different degrees of intensity).
Not to bore the reader, I´ll pick a few episodes and explain the reason behind the pattern. If the explanation is convincing, we will be able to see what will make it possible for the Goldman Sachs prediction for the future rate of unemployment, that remains low going forward (not spiking) to materialize.
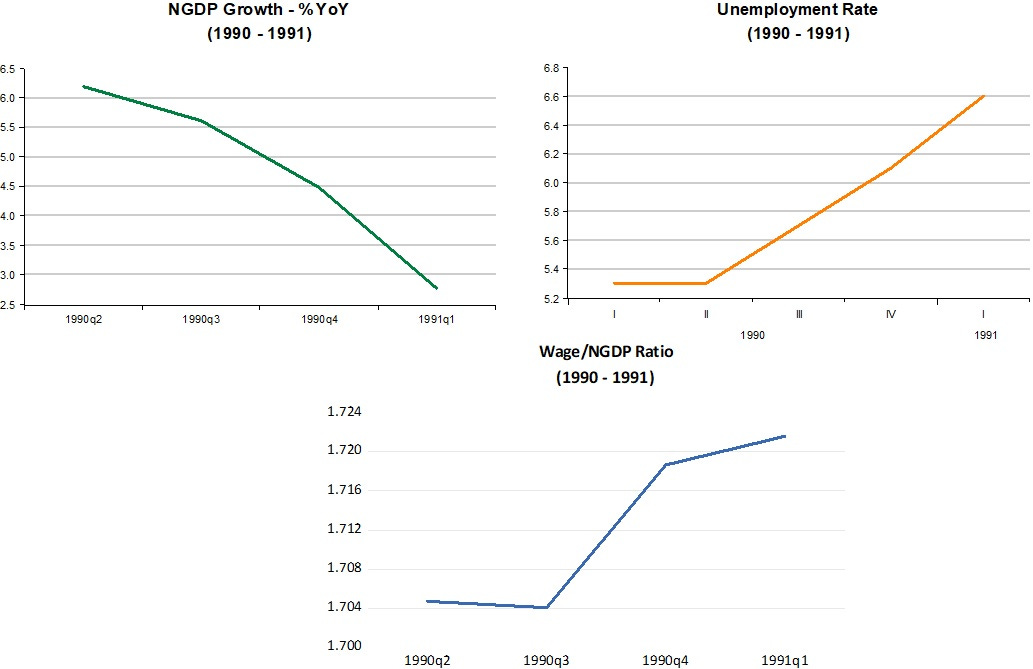
The first “evidence panel” for the “spiking rate of unemplyment” shows the 1990/91 recession. For the unemployment rate to spike you need a significant fall in aggregate nominal spending (NGDP) growth (a tightening of monetary policy). Since wages are sticky, the rate of unemployment will be “guided” by the rise in the wage/NGDP ratio. The intuition behind this result is that the “dearth of aggregate demand” requires a fall in wage growth. Since wages are sticky this doesn´t happen, so unemployment inevitably rises.
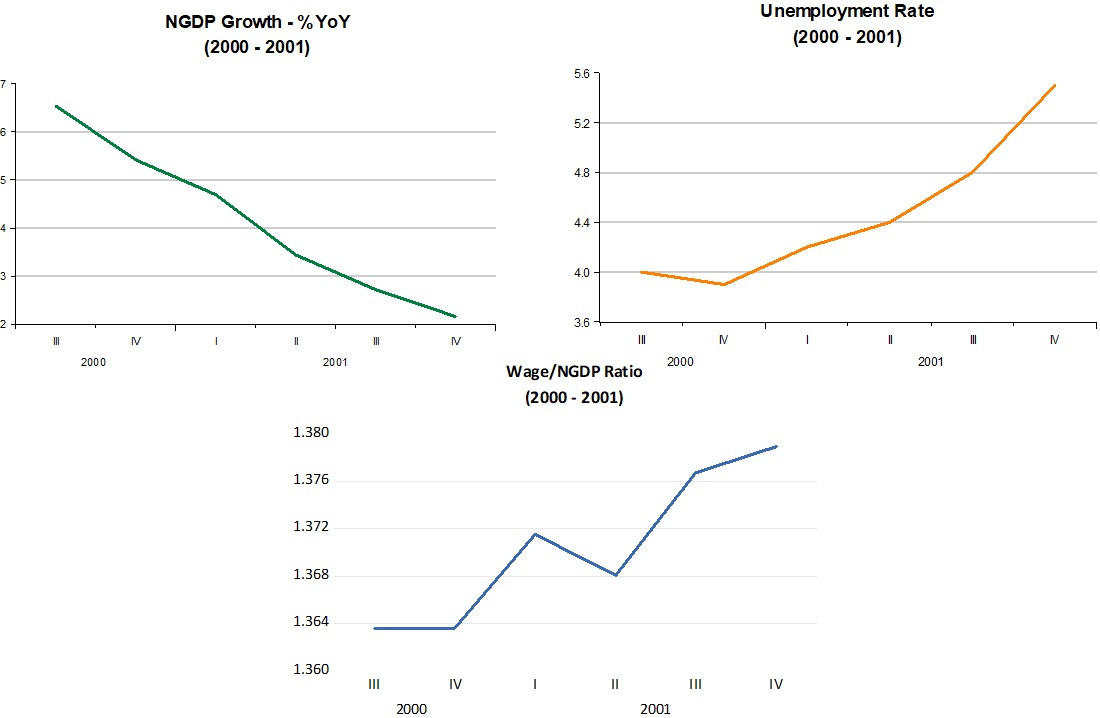
No new words needed to account for the unemployment spike in the 2001 recession.
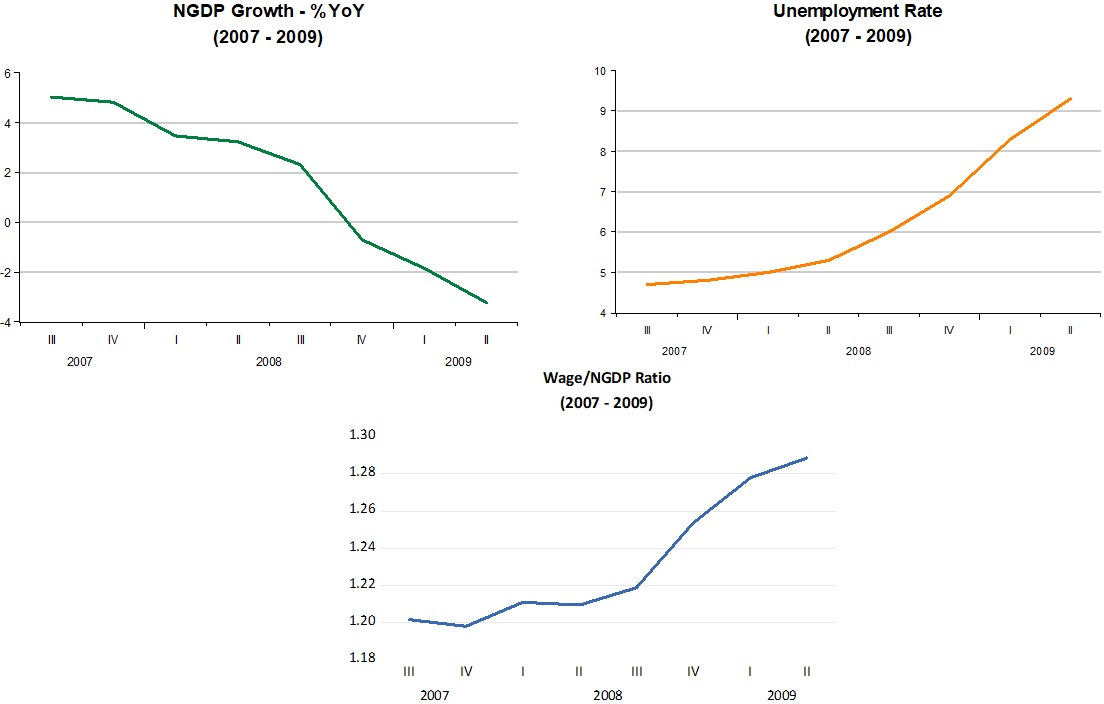
In the Great Recession things were quite nasty, with the unemployment spike being a lot worse (while others were a 2 or 3 in the Richter Scale, this time it was a 6 or 7).
NGDP growth went deep into negative territory (for the first time since the great Depression) and the Wage/NGDP ratio “climbed the Matterhorn”.
The flip side of the Great Recession was the “Depressed Expansion” that took place from 2009 to 2019, with unemployment taking almost 10 years to get back to levels that prevailed before the Great Recession. Why?
After falling deep into negative territory, NGDP growth climbed back to the 4% level. This was far from enough to get the level of nominal spending back to the trend path that prevailed before the GR, so that although NGDP growth was relatively stable going forward, it was significantly lower than the growth rate that was experienced before. So, a “double whammy” on spending: lower trend level and lower trend growth!
The charts show that the fall in unemployment was slow and protracted, with the same happening to the “forcing” ratio of Wages to NGDP.

The contrast between the Great Recession and C-19 is enourmous, with things happening much faster and stronger in the latter. In just one quarter NGDP growth crashed into very deep negative territory while unemployment ballooned just as quickly to heights not seen since the Great Depression. With sticky wages the Wage/NGDP ratio skyrocked.

In contrast to the GR, this time around the Fed reacted very quickly to the very big and sudden fall in velocity (increase in money demand). NGDP growth rebounded swiftly and strongly. The wage NGDP ratio fell fast as did the rate of unemployment.
In just two years the rate of unemployment was back to levels that prevailed immediately before C-19 hit.

These preliminaries help us understand the “spiking patter” of unemployment observed through history, so now we will be able to understand the assumptions behind Goldman Sach´s prediction of a stable and low rate of unemployment going forward.
Almost two years ago, the level of unemployment came down to pre-C19 levels. Since then, it has fallen a bit, remaining quite stable. That´s already a longer period of low & stable unemployment than we are accustomed to observe. Why?
The charts below illustrate the past year. Observe the differences to previous periods. The notable one is that this time around, while NGDP growth is falling, the unemployment remains low and stable. The Wage/NGDP ratio is also stable.
The difference is that now the fall in NGDP growth cannot be seen a a tightening of monetary policy, just a “less easy one”! Observe that while in previous episodes NGDP growth fell below its trend growth, now NGDP growth is converging to its stable growth from above, with NGDP growth falling from the lofty levels it attained in 2021.

The fall in NGDP growth has brought inflation down, with no effects on the unemployment rate largely because the Wage/NGDP ratio has remained stable. In other words, wage growth (that sometime ago made many worry about its inflationary impact) has been falling in tandem with NGDP growth.
Goldman Sachs assumption, therefore, is not “hopium”, but reflects the view that the Fed will keep NGDP growth falling to a 5% growth rate, say, that will be maintained. With that. the likelyhood that the Wage/NGDP ratio will remain stable is high, and that will help keep the unemployment rate also low and stable, making it “this time is certainly different” come to pass.
How is the "Wage/NGDP Ratio" calculated?