
Greenspan´s search of productivity
Greenspan´s search of productivity
One of the reasons behind the "splendid 1990s"

Bringing back this very old piece (originally in Portuguese) was motivated by a tweet from Guy Berger:

Neil's point makes me think - is there any good historiography about economic measurement of the late 1990s productivity boom? I know Greenspan was early to figuring this out, but there were also skeptics.
Fortunately, the universe of the American economy is not populated only by Jurassic, Phillips Curve worshippers, asset inflation, and other ever-changing skeletons, buffeted by the winds of growth.
Greenspan, for example, seems to have more noble and relevant concerns. The photo below, adapted from Business Week, is illustrative. It shows that concern with productivity (or with the search for evidence that productivity is growing rapidly) occupies most of the brain, although more popular issues, such as stock market exuberance (S&P), currency, etc., also have their bins.

In recent years, the arguments used to characterize the behavior of the American economy have tended toward impressionism. However, these arguments have not stood the empirical test of the passage of time. By these arguments, stocks would have to have already "corrected". GDP growth declined. The unemployment rate, as well as the inflation rate, increased and, above all, interest rate risen substantially. None of this, however, was observed.
The "new age" crowd also appeals to Impressionism. According to them, the "technological revolution" has changed the world. If for the Jurassics the traditional models would still be valid, for the "nouveaux economistes", the world, or at least the American economy, would have arrived at the gates of paradise, lulled by the technological revolution.
While the former rely on (possibly incomplete) models, the latter seem to be guided by a primer of faith. Between the two camps, there is no intersection that allows for constructive debate.
My view is different, in that I try to find objective reasons that can contribute to the explanation of the observed facts. However, serious analysts, in trying to shed light on the debate, are faced with the precariousness of the available data, which contributes to greater divergence in conclusions. From a practical point of view, these divergences are reflected in the doubts that Greenspan (and other members of the FOMC) constantly express regarding the real behavior of productivity. and, therefore, on the optimal conduct of monetary policy.
Figure 1 is indicative of the difficulties in identifying productivity behavior. It can be observed that, for the post-war period and until the beginning of the 1980s, the evolution of productivity is similar when comparing total productivity with productivity pertaining exclusively to the manufacturing sector. From the early 1980s onwards, the divergence is stark. Total productivity is growing at much lower rates than those seen in the manufacturing sector.

Between 1950 and 1972, the two measures of productivity evolved at very similar rates (annual average of 2.6% for the manufacturing sector and 2.7% overall). The period between 1973 and 1982 is characterized by low productivity growth, 1.7% per year in the manufacturing sector and 1.1% overall. This period was marked by three recessions, two oil shocks (which represent a negative productivity shock), rising and volatile inflation, price controls (1971 to 1974), political turmoil, and misguided (and uncredible) economic policy strategies.
From 1982 to the present, the average productivity growth in the manufacturing sector has been 3.1 percent per year, while overall, the growth (1.2 percent) has been about the same as in the previous period (1.1 percent). In the last four years, there has been a significant improvement in these indexes, with productivity in the manufacturing sector growing 4.4% per year and 2.0% overall.
It's a paradox that overall productivity data doesn't reflect the era of extremely rapid technological progress that most claim we live in. In addition, coinciding with the emergence and subsequent explosion of information technology, we began to see a growing divergence in the measurement of productivity.
An immediate explanation could be that we are now facing serious measurement errors. But this wouldn't exactly be a new fact (why would the measurement process be more efficient before?). One answer, suggested in 1994 by Zvi Grilliches of Harvard University, states that the greater difficulty in measurement reflects the increased importance of "immeasurable" sectors (i.e., sectors in which output is difficult to measure). In the immeasurable sectors, he includes construction, trade, finance, other services, and government (measurable sectors include: agriculture, manufacturing, transportation, communication, and utilities). To close the argument, Grilliches notes that, in the years that followed the end of WWII, half of the economy was in the measurable sectors. That ratio had fallen to less than 1/3 in 1990.
In order not to be subject to criticism that his analysis focuses on long-term structural movements, Grilliches also notes that in the early 1990s, more than three-quarters of spending on computers took place in immeasurable sectors. Given that output is difficult to measure in these sectors, it is not surprising that there is no more significant evidence of productivity growth. Thus, in Chart 1 above, the divergence between the productivity observed in the manufacturing sector and in general would basically be reflecting measurement problems. A breakdown of the data shows that, despite all the technological progress of the last 20 years, since 1977, productivity in the services sector has fallen at a rate of close to 0.5% per year!
That seems implausible, but the difficulties don't end there. Not only has the composition of GDP changed, containing a greater share of products from immeasurable sectors, but the increasing share of the goods we are trying to measure is changing faster than in the past, further increasing the difficulties of measurement. Two examples, taken from important components of current consumption expenditure - medical care and personal business services (in this case insurance) - are illustrative. These segments are primarily measured by inputs (not output). Official data estimates the output of doctors and insurance agents based on the number of hours worked, not the treatment success rate or the number of policies generated. Therefore, statistics assume that productivity growth in these areas simply does not happen. It is worth noting that these two categories of consumption had their shares increased in total consumption expenditure, from 11% in 1959 to more than 25% in 1994, showing the potential for error in the measurement of productivity, especially in the services sector.
Figure 1 showed the evolution of labor productivity, as measured by the ratio of output per hour worked. There is also a broader concept of productivity, which goes by the name of technological progress (or multi factor productivity (MFP). This is calculated as residual, i.e. it represents that part of the increase in output that is not explained by the increase in the use of factors of production. According to Robert Solow of MIT, technical progress could account for nearly 50 percent of growth. This productivity factor is often the result of prior investment in research and development (R&D), but it can also be the result of the implementation or operationalization of ideas that require little or no investment.
Due to the complexity of its calculation, the data for MFP is published with a three-year lag. Figure 3 shows the indicator of technical progress between 1948 and 1994 (released in 1997). The figure indicates that since 1973, there has been no technical progress at all, that is, the economic growth observed since then is due, in its entirety, to the increase in labor and capital. While between 1948 and 1972, technical progress grew at a rate of 1.8% per year, between 1973 and 1994 this growth is essentially zero.
This picture of the growth of the technological progress of the American economy in the last 25 years contrasts with the image that one has, and which is corroborated by scientific publications, that the country experienced an intense process of technological advancement in this period.

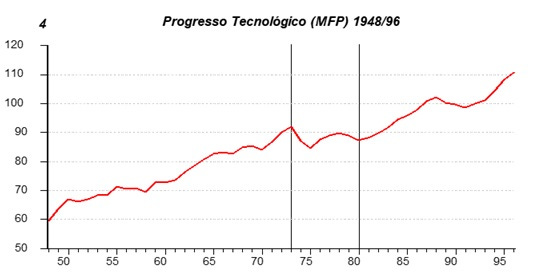
In the last update of these data (1999), which shows the evolution of technological progress up to 1996, history has been drastically revised. Figure 4 illustrates this fact. Between 1973 and 1980, productivity also did not grow, a fact that seems to be associated with the negative shocks that occurred in this period. After 1980, Figure 4 shows, contrary to what is observed in Figure 3, that technical progress grew at a rate of 1.3% per year.
Thus, it seems that the measurement problems are gradually being solved. However, how can we know if the revision of the data reflects, in fact, an improvement in the calculation system. An answer can be obtained from the contrast between the behavior of technical progress in the two versions and the behavior of the stock market in the period. As the stock market, to a large extent, reflects the expectations regarding the growth of the economy as a whole, and as this evolution depends on what is happening with technical progress, the behavior of the stock market, therefore, should follow the evolution of technological progress (productivity).
Figure 5 indicates that the original calculation of the MFP (5A) was not very consistent with what was happening with the stock market (Dow-Jones). Between 1965 and 1981, the stock market remained stagnant, returning to an upward trend from 1982 onwards. The revised trajectory of the MFP (5B) is much more consistent with the observed behavior of the market.

In this context, in an article that has just been published, Leonard Nakamura, from the Federal Reserve Bank of Philadelphia, seeks to understand, among other things, the behavior of the American stock market as a rational reaction of investors to the improvement of the macro-economic outlook of the United States.
Nakamura notes that since the 1950s, investments in R&D for the creation of new products (which are usually accounted for as current expenses) have more than doubled as a proportion of the output of the non-financial corporate sector, while tangible investments in machinery, factories and equipment remained practically stable.
By Nakamura's calculations, the accounting profit of the companies would be underestimating the economic profit (adjusted for R&D investment) by 35%. By the same calculations, the current P/E ratio would be overestimating the true P/E by the same amount. This significantly qualifies the notion that the stock is overvalued, especially given that the prospects for future earnings (the expected success of investments in R&D and other investments in intangibles) remain positive.
This analysis also explains the close correlation between the Dow and technological progress captured in Figure 5B above. (In other words, the market was “seeing” things that the data initially didn´t show!).
If any conclusion can be drawn from the analysis, it is that we are, as analysts, highly dependent on statistics and that, unfortunately, the conventions for raising them can easily lead us to misread the fundamental forces that disrupt the pace of economic activity.
Marcus Nunes – July 1999
References:
Zvi Grilliches: Productivity, R&D and the data constraint. AER March 1994
L Nakamura: Intangibles, What put the New in the economy? Business Review Fed Philadelphia July/Aug 1999
Note that Greenspan said: "the unprecedented slowdown in savings starting in 1965 eventually funded a persistent below-average growth of capital investment and hence of nonfarm output per hour between 1973 and 1995, with estimates of growth closer to a 1.4 percent annual rate than to the average annual rate between 1870 and 1970 of 2.2 percent."
Greenspan: "The trade-off between social benefits (mainly Social Security, Medicare, and Medicaid) and savings, is almost a dollar-for-dollar substitution of consumption for gross domestic savings. That detracts from the funding of capital investments, and hence from output per hour".