
Figuring out why 2023 was so surprising
Figuring out why 2023 was so surprising
A proper understanding of monetary policy "solves the puzzle"

In late 2022, it appeared that 2023 was going to be the Annus horribilis:
From Bloomberg:
All across Wall Street, on equities desks and bond desks, at giant firms and niche outfits, the mood was glum. It was the end of 2022 and everyone seemed to be planning for the recession they were convinced was coming. The biggest names at the biggest firms were predicting the S&P 50O Index was about to tumble and telling clients to prepare for a plunge in Treasury bond yields. Some strategists were talking up Chinese assets after Beijing’s sudden end to Covid-19 precautions. Together, these three calls—sell US stocks, buy Treasuries, buy Chinese stocks—formed the consensus view on Wall Street. Then came 2023. “I’ve never seen the consensus as wrong,” said Andrew Pease, the chief investment strategist at Russell Investments, which oversees around $290 billion in assets. “When I look at the sell side, everyone got burned.”
As we now know, quite the contrary happened, but there are always those willing to predict a recession on the horizon, so it´s not surprising to read that as 2024 begins, now there´s a 99.5% probability of recession starting this year!
Arturo Estrella @intheyield
MONTHLY RECESSION WATCH: For December, the 10yr-3mo Treasury spread continued to fall once more and averaged -1.31%, consistent with a 99.5% probability that a recession will start in 2024.
For more than 35 years Estrella has explored the ability of the yield curve to predict recessions. In a 1996 article in “Current Issues in Economics and Finance of the New York Fed”, written with Frederick Mishkin, they conclude:
This article has examined the performance of the yield curve spread and several other financial and macroeconomic variables in predicting U.S. recessions. The results obtained from a model using the yield curve spread are encouraging and suggest that the yield curve spread can have a useful role in macroeconomic prediction, particularly with longer lead times. Policymakers value longer term forecasts because policy actions typically take effect on the economy with long time lags. Thus, the fact that the yield curve strongly outperforms other variables at longer horizons makes its use as a forecasting tool even more compelling.
The next chart indicates, considering the 4 recessions since 1982, that this time the pattern that emerges is quite different (considering that the shortest recession on record in 2020 was completely “motivated” by C-19).
The chart shows that for the 19990/91 recession (gray bars), the spread first turned negative 11 months before the recession began, and turned positive 7 months before.
In the case of the 2001 recession, the spread first turned negative 8 months before the recession began, and turned positive 6 months before it began.
For the 2007/09 recession, the spread first turned turned negative 16 months before the recession began, and turned positive 1 month before.
Now, the spread first turned negative 13 months ago. It has, however, turned much more negative than in the other instances and also different from previous occasions it shows no sign of turning positive, turning down again in recent months. Maybe this will push the “inevitable” recession forward to 2025 (maybe 2026?)!

There are also those who think that both the inflation and disinflation was mostly due to supply shocks. Claudia Sahm is a “leading figure” of this group:
Chair Jay Powell is not flying the plane [for soft landing], despite the popular narrative. He’s sitting in first class but giving the Fed credit means we could learn the wrong lessons.
There’s a lot to unpack here. I agree it’s time (or very soon) to cut rates due to the clear momentum toward 2%. And yes, inflation primarily Covid/Putin disruptions unwinding.
The next chart depicts demand shocks (positive or negative) and supply shocks (positive or negative) and how their interaction produces outcomes for real growth (Y) and inflation (P).
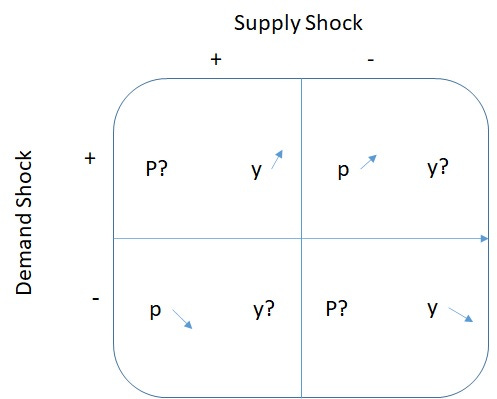
For example, the first quadrant indicates that in the case there is both a positive demand and supply shock, the effect on growth is well determined but the effect on inflation is uncertain. While the positive demand shock tends to increase inflation, the positive supply shock tends to decrease inflation. The end result will depend on the relative intensities of the two shocks. If the positive supply shock is stronger than the positive demand shock, inflation will fall (while real growth increases).
Looking at quadrant 3, in the case of a negative demand shock and a positive supply shock, the effect of this combination of shocks will definetly reduce inflation but the effect on growth will depend on the relative intensities of the two shocks. If the negative demand shock is stronger than the positive supply shock real growth will fall.
And so on and so forth for the other quadrants.
In the analysis that follows, a demand shock - a shift in the aggregate nominal spending (NGDP) growth curve, up & to the right in the case of a positive shock, and down and to the left in the case of a negative demand shock - is due to an excess supply of money, in the case of a positive D shock, or to an excess demand for money in the case of a negative D shock. Those shocks are fundamentally Fed determined.
Looking at the NGDP growth curve, if NGDP growth is on a rising trend (monetary policy is expansionary/easy) we identify a positive demand shock and if NGDP growth is falling (monetary policy is contractionary/less easy) , we identify a negative demand shock. If NGDP growth is on a stable path, monetary policy is providing nominal stability.
A supply shock - a shift in the aggregate supply (RGDP) growth curve up and to the left in the case of a negative shock, and down and to the right in the case of a positive shock, may be due to changes in productivity or exogenous changes in prices of important inputs (like oil). It may also be due to supply disruptions (like those caused by C-19).
Looking at the RGDP growth curve, if RGDP growth is rising, we identify a positive supply shock and if RGDP growth is falling, we identify a negative supply shock. If RGDP growth is on a stable path, we have real stability, closely associated with nominal stability.
To represent inflation I use the Harmonized Index of Consumer Prices (HICP). The HICP differs from the CPI in two major respects. 1. the HICP includes the rural population in its scope and, more importantly, 2. the HICP excludes OER. Its core version also excludes, like the CPI, food & energy.
To analyse the recent inflation process, in particular if it is due to demand and/or supply factors (as Sahm puts it: Covid and Putin), I take the period from 2020.11, just before inflation took off, to the most recent data point (2023.11). I divide the period into 6 Zones to aid in the identification of if it reflected demand and/or supply shocks. For reasons that will be made clear Z4 is divided in two.
The charts set the stage for the analysis.


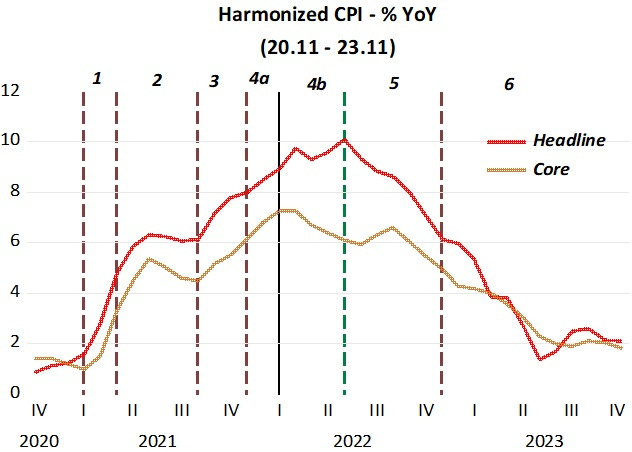
In Z1, a positive demand shock clearly predominates over the negative supply shock from C-19 disruptions because both real output growth and inflation increase. There is evidence that the demand shock was Fed-induced. On February 10, Powell gave a speech entitled “Getting back to a strong labor market” (at that moment unemployment stood at 6.3%). In the following FOMC Meeting, in March, we read:
The Committee decided to keep the target range for the federal funds rate at 0 to 1/4 percent and expects it will be appropriate to maintain this target range until labor market conditions have reached levels consistent with the Committee's assessments of maximum employment and inflation has risen to 2 percent and is on track to moderately exceed 2 percent for some time.
In Z2, demand and supply shocks are more evenly balanced. The negative demand shock is viewed in the drop in NGDP growth. RGDP growth falls but inflation doesn´t change much (it would have to rise more forcefully if the supply shock predominated).
In Z3, again, the positive demand shock predominates. Inflation rises, as expected, but RGDP also rises (it should have fallen if the negative supply shock predominated).
In Z4a, NGDP growth barely moves (no additional easing of contraction of monetary policy) but RGDP growth falls and inflation rises, hallmark of the negative supply shock from Covid disruptions predominating.
Z4b is interesting, showing Putin´s hand in the process. With NGDP growth falling, monetary policy becomes less easy. RGDP growth falls. But now we have divergent moves in the inflation components. While the headline component increases due to the rise in oil following Putin´s war, the core component falls! The Fed´s monetary policy was appropriate, not trying to offset the inflation effect of the rise in oil prices, at the same time keeping core inflation in check. Here, again we have both demand and supply factors affecting the process!
In Z5, demand factors predominate. NGDP growth falls and so does RGDP growth, while inflation falls. If a positive supply shock predominated (fall in oil prices and Covid disruptions unwinding) RGDP growth would not have fallen.
In Z6, supply factors clearly dominate. Although monetary policy is becoming less easy, RGDP growth is rising and inflation is falling, hallmark of a positive supply shock predominating.
The conclusion from this analysis is that the, sometimes heated, discussion of the recent rise and fall in inflation being mostly determined by demand or supply factors is unproductive. And to go to the extreme of saying “Powell was not flying the plane”, is “injurious”. The Fed was very present at all times, having to navigate sometimes stormy skies.
The chart below shows the scene from an alternative (level) perspective. The “landing path” is very clear and the Fed is a wisker away from “smoothly touching the tarmac”.

re: "“I’ve never seen the consensus as wrong"
All inflation forecast for 1978 were drastically wrong. That's the difference between income velocity and the transaction's velocity.