"Conundrums"
It was Greenspan who invented the term in 2005

During his February 2005 congressional testimony, Alan Greenspan identified what he termed a conundrum. Despite the fact that the Federal Open Market Committee (FOMC) had increased the federal funds rate 150 basis points since June 2004, the 10-year Treasury yield remained essentially unchanged. Greenspan considered several explanations for his observation but rejected each.
The “conundrum game” has become an actively played sport, with pundits all over writing about the reasons the behavior of long rates diverge from what´s “conventionally expected”. (Just Google “conundrum/reverse conundrum and you´ll get hundreds of results).
The recent diverging behavior of long and short rates could be called an “augmented reverse conundrum” because long rates rose (did not remain level) when the Fed reduced the FF rate.
In what I called his “Job Market Paper”, Kevin Warsh argued:
The Fed has lowered rates by a total of one percentage point, starting with an ill-timed emergency rate cut of 0.50% in September. Yet the average 30-year fixed-rate mortgage is currently slightly above 7%, about 1% higher than it was in September. The purpose of cutting rates is to cut rates—clearly, that hasn’t occurred.
Instead of finding reasons for “divergent” interest rate behavior, I´ll provide some examples and see what happened in the aftermath of those “divergent” behaviors.
The first example goes back to the mid 1990s. Like now, when the Fed reduced the Fed Funds rate, 10 year yields climbed. We see what happens to important macroeconomic variables after this fact.
“The purpose of cutting rates is to cut rates” was clearly not satisfied. The near future, however, was quite exciting! Real growth went up and away, inflation remained low and stable, until it tanked due to the positive productivity shock of 1997, and unemployment fell consistently.
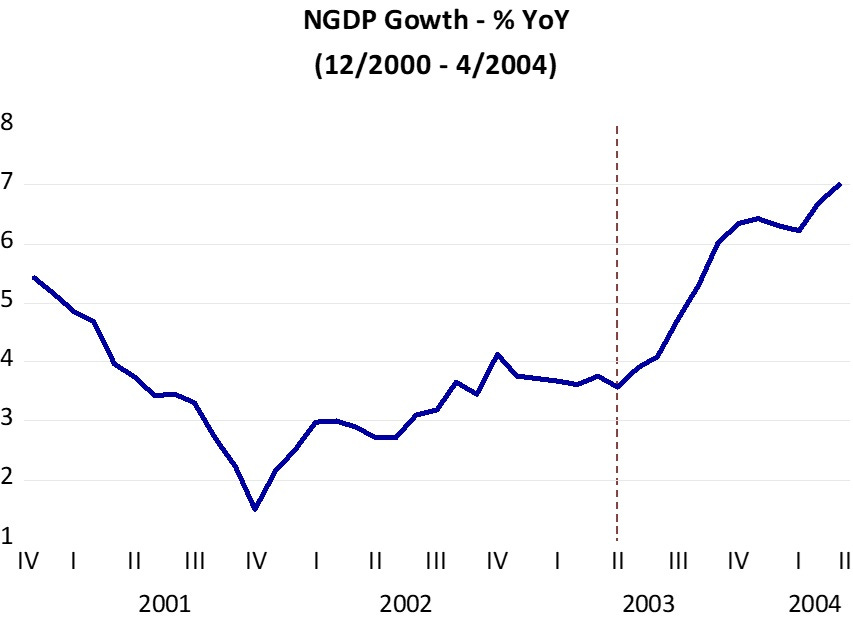
I now move to an example of reverse conundrum. Between late 2000 and late 2001, the Fed reduced rates significantly, from more than 6% to less than 2%. Long rates stayed put. Remember that 2001 was a recession year. The recession was short and shallow, but it lingered. It came to be called “job loss recovery”.
Note that real growth only picked up in mid 2003. Inflation, which had fallen way below target also picked up at that point, climbing back to target. Unemployment, which had continued to increase after the recession ended in late 2001 (job-loss recovery), also decreases consistently after mid 2003.
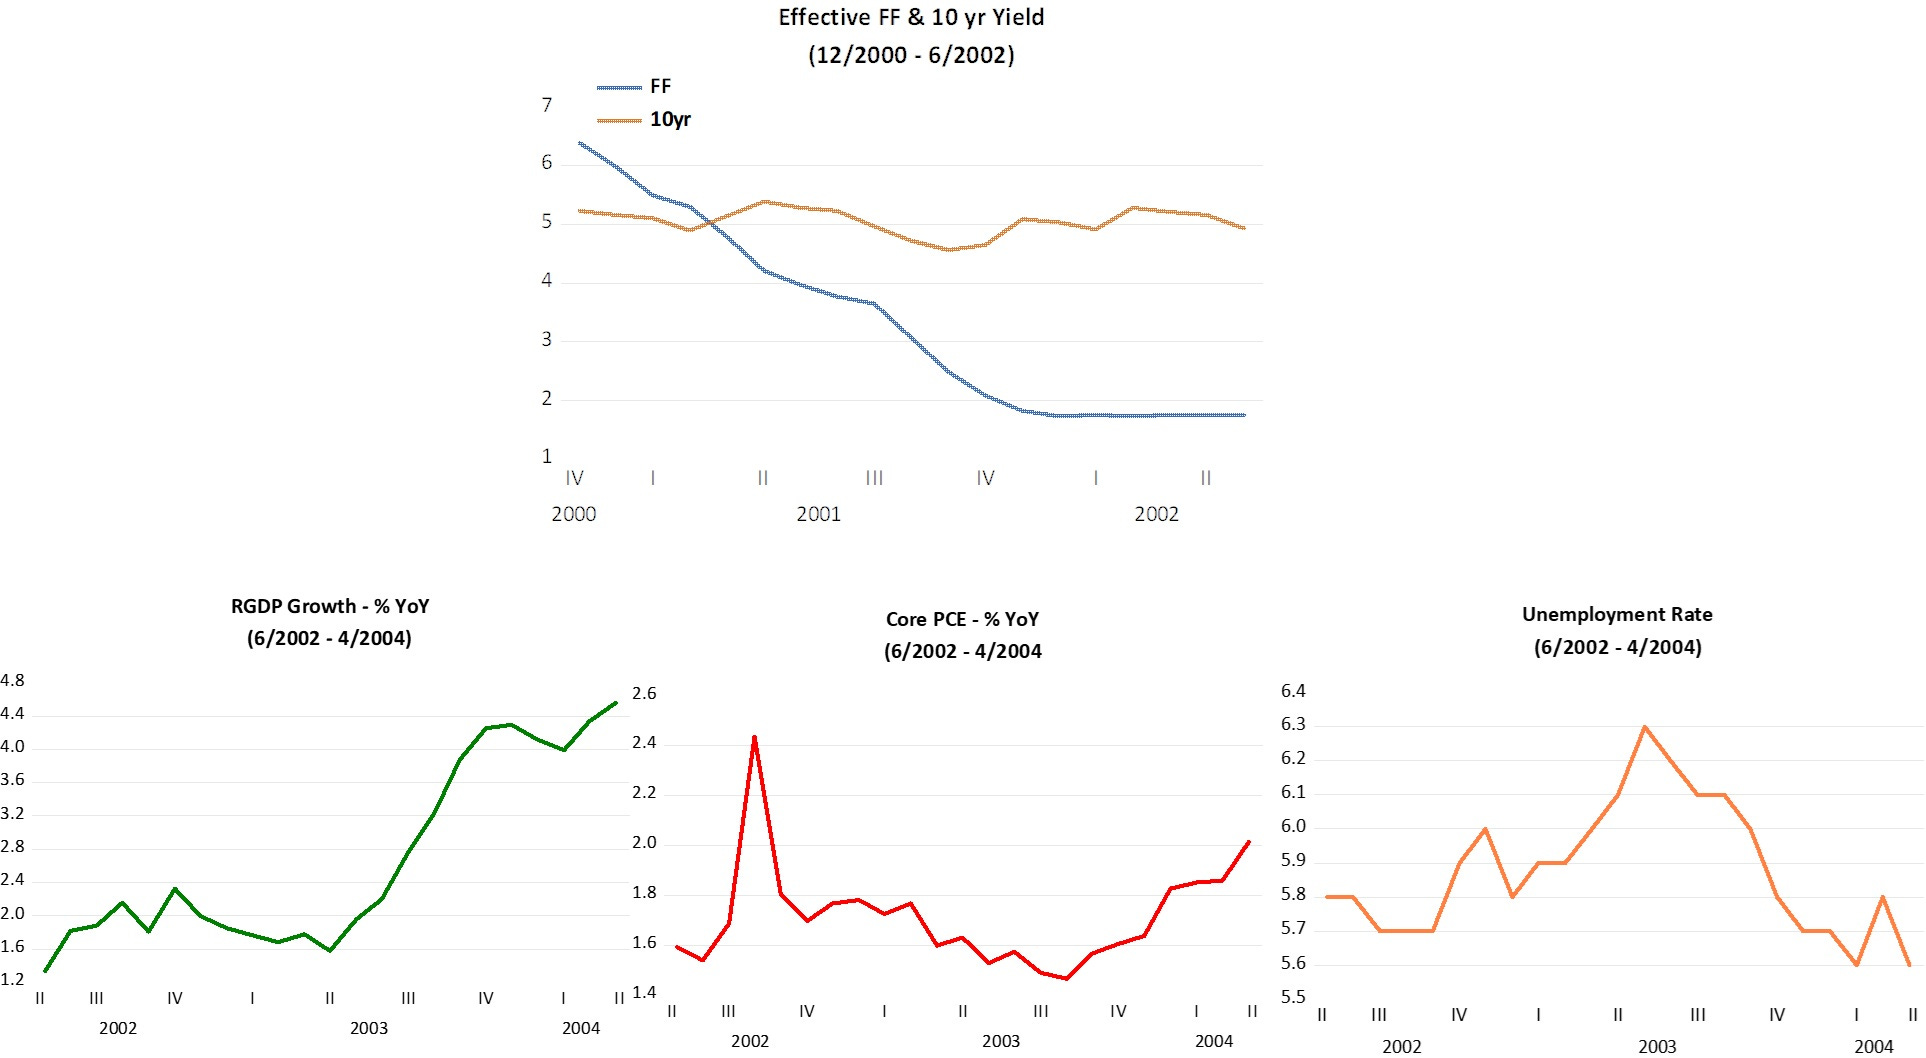
This episode provides strong evidence for the power of monetary policy. People would say that because the Fed Funds rates fell quite a bit, monetary policy was very easy (the Fed thought so too). If, however, you gauge the stance of monetary policy from the behavior of NGDP growth, you´ll conclude that monetary policy was tightening (NGDP growth falling) all the while rates were dropping!
In fact, it is only when monetary policy becomes expansionary after mid 2003 that the economy “wakes up”!
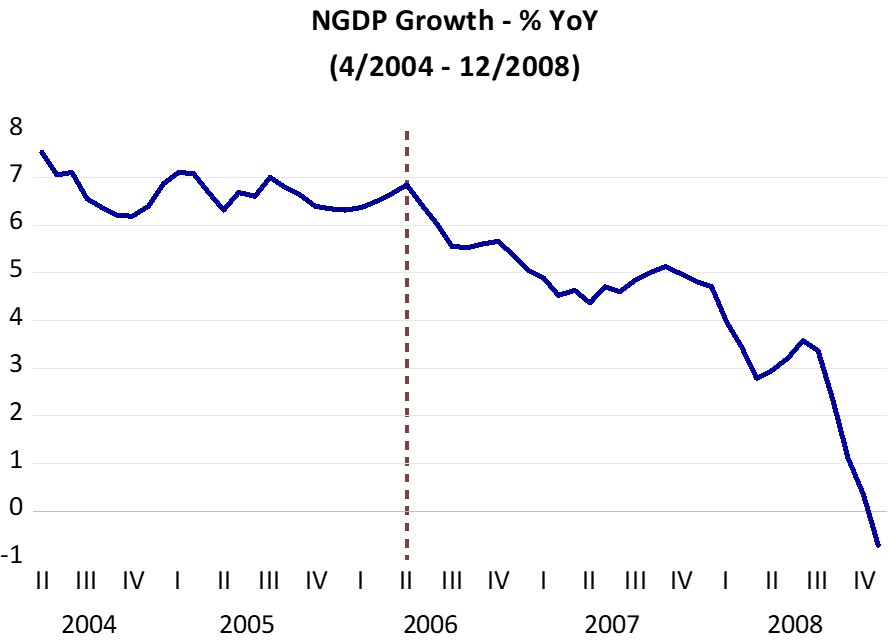
The next panel covers the original “Greenspan Conundrum”. The FF rate climbs consistently from 1% to 4.5%. Meanwhile, long rates remain quite stable, What happens to our macro variables following “the conundrum”?
Until mid-2008, RGDP growth trends gently down, impacted by a sequence of negative supply shocks (oil price increases). Core inflation is wobbly, but contained, refleting some pass through from oil prices. Headline PCE (not shown), however, rose significantly. Unemployment also remains contained until mid 2008.
At that point (mid 2008) all “hell brakes loose”. Real growth and Core PCE inflation tank while unemployment balloons.
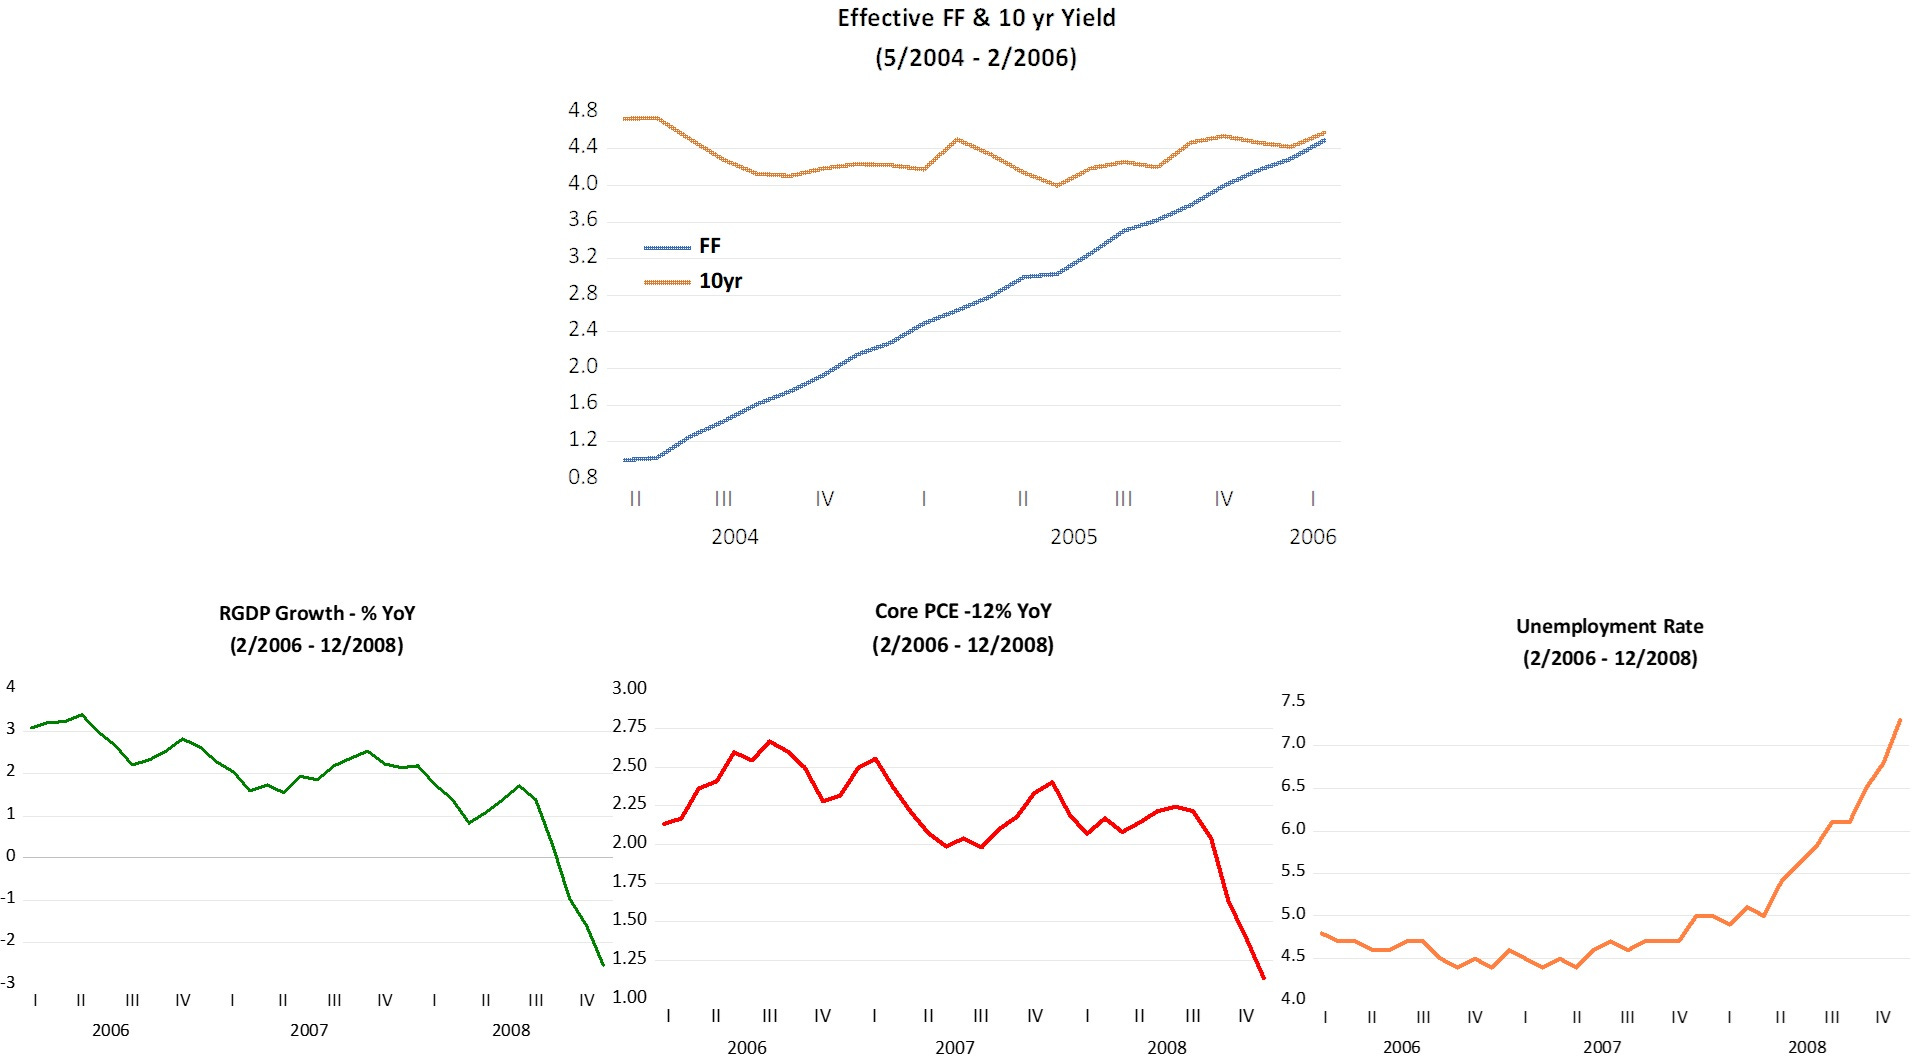
Two years ealier, long rates were predicting healthy real growth and contained inflation going forward. What happened? (Note: the GFC was a consequence).
Intially, in the first few months after Greenspan passed the baton to Bernanke, although the Fed kept the FF rate elevated, NGDP growth was stable, indicating that monetary policy was not tightening, nor loosening. By keeping NGDP growth stable, the effects of oil price shocks on growth and inflation were minimized.
The Fed got concerned about the inflation effects of the oil price shock and began to dampen the growth of aggregate nominal demand (NGDP), until it suddenly tanks going negative), an indication of massive monetary tightening.
At that point, the Fed Funds rate is drastically reduced, and long rates follow suite (not shown).
It is left as a speculative exercise for the reader to complete the bottom part of the next chart that shows the recent rate “anomaly”).
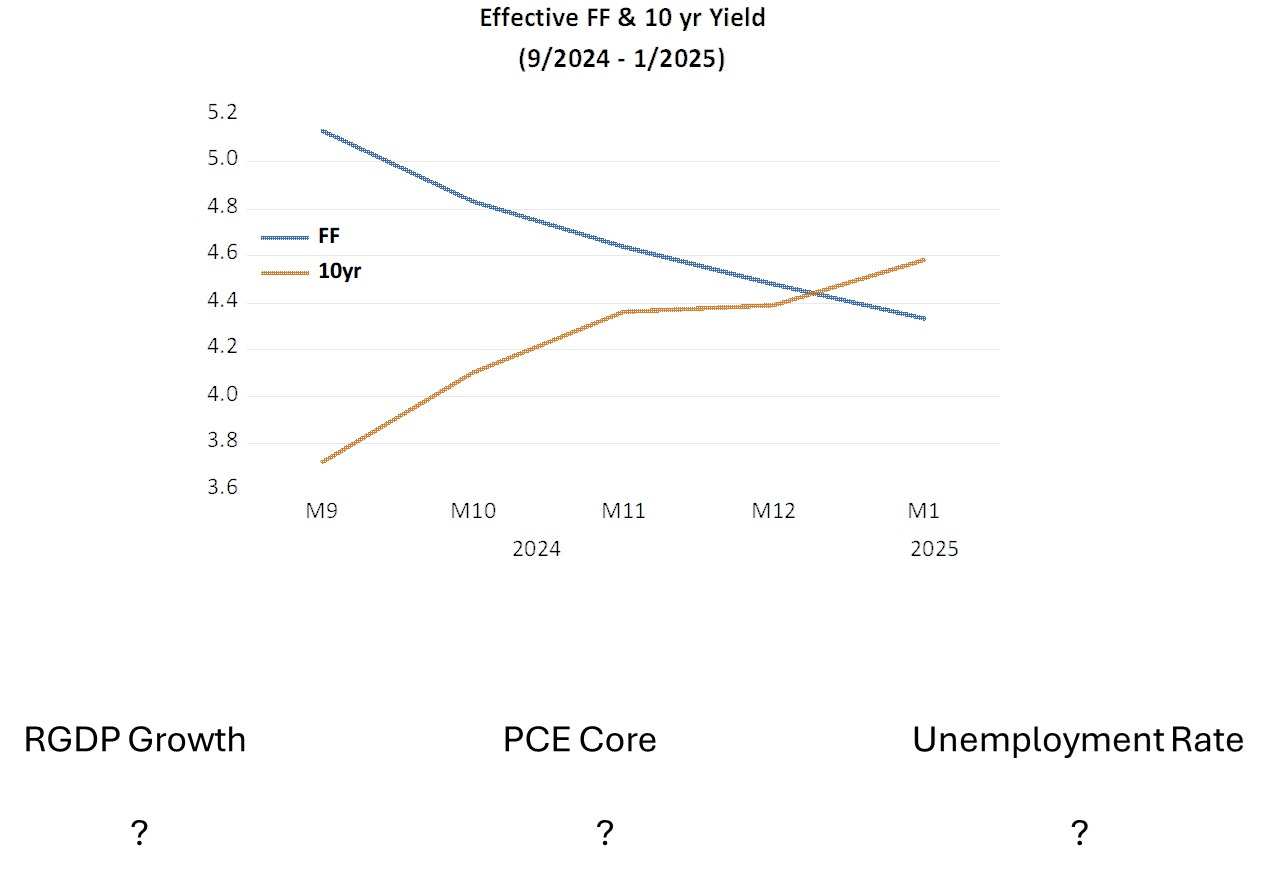
Hint: What happens to monetary policy (reflected in NGDP growth) is essential to outcomes. Unfortunately, with people like Kevin Warsh waiting in the wings for the top job at the Fed, I´m not very optimistic!
Short and long-term money flows don't always move together. They can move in opposite directions, as in the present case.
I sort of don't get why we should expect long and short rated to move tighten over a relative short horizon. Long term investors can be expecting changed in real demand for capital (right now for AI compute) or change in deficits that will require higher ST rates _in the future_ A "normal" static yield curve correspond to dynamic version of static equilibrium. All shocks dawn from the same distribution world without end.