In this post, I´ll show how different economies were similarly affected by the “pandemic big drop”. The “big drop” refers to the massive fall in the velocity of money (increase in money demand) that took place in early 2020 as a result of the rapid spread of Covid19.
The reaction of all the central banks of the seven economies reviewed (US, EZ, Canada, Sweden, Australia, Israel & Poland) was qualitatively the same.
This is not the natural state of affairs when dealing with different central banks. The charts below shows the different behavior of central banks around the Great Recession. There were two groups of central banks:
1) Those that, mostly due to the inflationary impact of the second leg of the oil shock in 2007-08 tightened monetary policy, allowing aggregate nominal spending, NGDP, to fall below the trend level path they were on, and
2) Those central banks that during this period “overlooked” the oil price shock and kept NGDP on the trend level path.
While the economies in the first group experienced a deep recession, those in the second group experienced only a real growth slowdown.
The first group comprises the following economies:
US, Euro Zone, Canada & Sweden
While the other three, Australia, Israel & Poland, are in the second group.
In the charts, Canada is the representative agent of the first group, while Israel represents the second group.
Monetary policy, maybe more than in other matters, is full of irony. Israel is a case in point. Stanley Fischer was Governor of the Bank of Israel from 2005 to 2013. More than 25 years ago he gave his views on Central Banking in “Central Bank Independence Revisited” American Economic Review,1995:
“In the short run, monetary policy affects both output and inflation, and monetary policy is conducted in the short run–albeit with long-run targets and consequences in mind.
Nominal- income-targeting provides an automatic answer to the question of how to combine real income and inflation targets, namely, they should be traded off one-for-one…Because a supply shock leads to higher prices and lower output, monetary policy would tend to tighten less in response to an adverse supply shock under nominal-income-targeting than it would under inflation-targeting.
Thus nominal-income-targeting tends to imply a better automatic response of monetary policy to supply shocks…
However, curiously, given his views in 1995 and given the performance of the Israeli economy around the Great Recession, just before stepping down from the BoI governorship in 2013, Fischer said in a speech:
There are those who support setting a nominal GDP target. I think that this is very impractical. The data that we receive on nominal GDP are very unstable. There are changes of whole percentage points between the various estimates of GDP. For this reason, I think that there is no reason to use nominal GDP as a target.
[Note: He likely thinks keeping track of concepts such as “potential output” or “natural rate of unemployment” is less impractical]
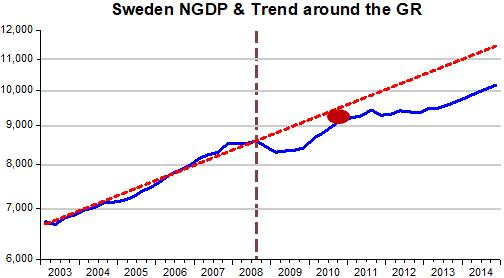
Within the first group, Sweden stands out as a “special case”. As the chart shows, after letting NGDP tank in 2008, by late 2010, it was well on the way to take NGDP back to the original trend level path. But then it became “nervous” about asset (house) prices and tightened again!
As the following quote indicates, the NGDP drop was a common occurrence for inflation targeting central banks that did not discriminate supply shocks:
This is what we read from the minutes of the Riksbank Meeting of September 2008!!!:
The Executive Board of the Riksbank has decided to raise the repo rate to 4.75 per cent. The assessment is that the repo rate will remain at this level for the rest of the year… It is necessary to raise the repo rate now to prevent the increases in energy and food prices from spreading to other areas [oil and commodity prices had peaked 3 months earlier].
One of the “fathers” of Inflation Targeting, Lars Svensson, at the time a Deputy Governor of the Riksbank, was in favor. But he later recanted and was all for more expansionary monetary policy. Unfortunately in late 2010 the Riksbank started to fret about house prices. Svensson dissented and went on dissenting until he resigned in disgust in April 2013.
Moving to the present time, the set of charts below depict the working of monetary policy going into the pandemic. The stance of monetary policy is given by the growth of aggregate nominal spending (NGDP growth). If NGDP growth is falling, for example, monetary policy is tightening. This happens when money supply growth does not adequately offset changes in velocity.
A few words to better understand the charts. In the region labelled 1, monetary policy is in “tightening mode”, meaning that money supply growth is not adequately offsetting the fall in velocity so that NGDP growth is falling. The region labelled 2 indicates monetary policy is generally expansionary. In this region, money supply growth is more than offsetting the change in velocity or is just offsetting so that NGDP growth is stable.
In the US example, I use monthly NGDP data (available at IHS Markit) to February 2021. When you compare the US with Australia, shown side by side, you see that in the US, the “Big Drop” was a surprise. Until the pandemic hit, NGDP growth was very stable at the “chosen” 4% growth rate. Lately, however, the Fed has been content in keeping NGDP growth at 0% (which makes all the talk about looming inflation rather ludicrous).
In Australia, monetary policy began tightening several months before the pandemic hit (despite the continuous fall in the RBA´s policy rate). When the pandemic hit, the outcome of this surprise was a significant tightening of policy.
All other pairs of countries show the same general pattern.
The Euro Zone is shown to have had the tightest monetary policy, with NGDP growth falling the most and recovering the least, with NGDP growth “stabilizing” at -4%, of all the countries shown.
The next set of charts illustrate the challenge the different central banks face. They are of the same nature, differing only in the details.
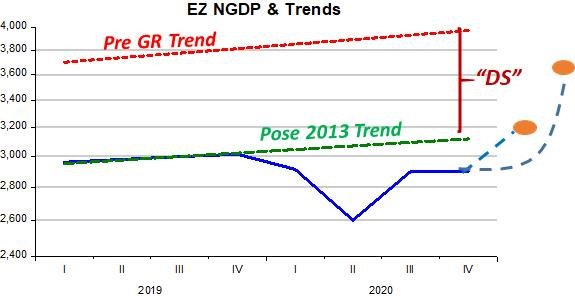
For each country, there at least two level trend paths to consider returning to. One is the pre Great Recession trend, or in the case of Australia, Israel and Poland that remained on that trend path until a later date before “stepping down” to a lower trend, and the level trend followed thereafter. The exception is Canada, that “lost its way” twice.
The “decision space” is the area between the lower and upper trend level path. It “defines” the alternative levels each central bank must decide to take the economy. I acknowledge that different speeds of “recovery” will have implications for temporary increases in inflation. That, however, shouldn´t be a constraint on the decision, especially because all the countries have the same problem of “too low” (below target) inflation at present.
Central Banks have the “power”. Will they use it wisely? At present they seem to be “afraid”. We can only Hope they “wake up”!


