
Both "Inflationistas" & "Recessionistas" see the economy in the dumpster in 2023!
Both "Inflationistas" & "Recessionistas" see the economy in the dumpster in 2023!
Fortunately, both "monetarists" & "Phillips Curvers" get it wrong

To set the stage, a couple of quotes from “representative agents” of both camps:
Steve Hanke: “The Federal Reserve's money-supply mistakes mean a recession is coming.” (my bolds)
Thanks to the Federal Reserve’s monetary mismanagement, Americans are suffering from economic whiplash. Americans enjoyed a post-Covid economic boom. Then, they were hit with high inflation. Now, they are staring down a recession in 2023. How did this happen in just three short years?
All roads lead to the Federal Reserve, where chairman Jerome Powell has rejected the quantity theory of money (QTM), a theory which states that inflation and economic growth are inextricably linked to the money supply (measured by M2). It’s a theory that was famously championed by Milton Friedman, who was unquestionably the master of monetarism (read: the QTM).
Larry Summers: “More People Must Lose Jobs to Fight Inflation”
Former Treasury Secretary Larry Summers joined Bloomberg’s Wall Street Week last week to praise the Federal Reserve for having “come around” to the view that “there’s going to need to be increases in unemployment to contain inflation.” (which means a recession is in the charts).
And then there is this long quote from William A Barnett, taken from chapter 24 of his edited book “The Theory of Monetary Aggregation” (my bolds):
The date September 26, 1983 is of unusual significance to the field of monetary economics. The now widespread views on the ‘instability of money demand’ find their origins in a conspicuous error made on that day. On that day, Newsweek magazine published on p. 84 a misguided full page article that has dramatically altered the way in which the public, the press, and the economics profession look at monetary data. The article contains a photograph of its author and a title, ‘A Case of Bad Good News.’ At the center of the page is a highlighted statement in bold print stating:
‘The monetary explosion leaves no satisfactory way out of our present situation.’ The author explains in further detail within his article: “The monetary explosion from July 1982 to July 1983 leaves no satisfactory way out of our present situation. The Fed’s stepping on the brakes will appear to have no immediate effect. Rapid recovery will continue under the impetus of earlier monetary growth. With its historical shortsightedness, the Fed will be tempted to step still harder on the brake – just as the failure of rapid monetary growth in late 1982 to generate immediate recovery led it to keep its collective foot on the accelerator much too long. The result is bound to be renewed stagflation – recession accompanied by rising inflation and high interest rates... The only real uncertainty is when the recession will begin.”
The author of that article was Milton Friedman. Others who identified themselves as ‘monetarists’ at the time sounded the same alarm. The recession never came. ‘Monetarism’ has never recovered. While stability of money demand is necessary but not sufficient for the ‘monetarist’ view, the damaged monetarist policy position was equated in the minds of many academic researchers with the view that the money demand function had ‘broken down.’ The favored monetary aggregate among monetarists at that time, including especially Friedman, was simple sum M2.
The monetarist view of the time was that a surge in inflation was unavoidably on the way, as the inflationary shock worked its way through the economy, and a subsequent recession produced by a Federal Reserve contractionary ‘overreaction’ was also unavoidable. The prediction of an unavoidable eventual recession is very much ‘monetarist’ and was therefore controversial among non monetarists, but the forecast of inflation seemed undeniable.
Under virtually every view in macroeconomics, a correlation between money growth and neutral or near-neutral changes in nominal variables is predicted. Hence that aspect of Friedman’s prediction should concern everyone. There are only two possible conclusions: either money growth has no effect on prices, and hence all macroeconomic theory is wrong, or simple sum M2 is a terribly defective measure of monetary service flow.
And continues:
September 26, 1983 was indeed a significant date in the history of economic thought. But there is another reason to remember that day. On precisely that same day, another article appeared in a magazine with a public ‘on the record’ forecast by an economist, a photograph of that economist, and a boldface article title. The title of that article was ‘What Explosion?’ The article, which appeared on p. 196 of Forbes magazine on that day explains further
“that people have been panicking unnecessarily about money supply growth this year. The new bank money funds and the super NOW accounts have been sucking in money that was formerly held in other forms, and other types of asset shuffling also have occurred. But the Divisia aggregates are rising at a rate not much different from last year’s... the ‘apparent explosion’ can be viewed as a statistical blip.”
Yes, you have guessed it. The subject of the article was the Divisia monetary aggregates, which I had developed and advocated in earlier work, and which were the basis for my statements to Forbes magazine. A controlled ‘experiment’ of this sort is rare in the field of economics. Friedman and I went on the record on the exact same day with the dramatically different forecasts implied by the two different methods of monetary aggregation.
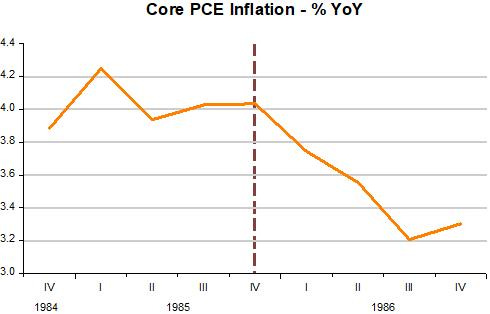
The chart below shows what happened to real growth and inflation for more than 2 years following the respective ‘predictions’ made by Friedman & Barnett, a period long enough to accommodate the longest of ‘conventional lag in the effect of monetary policy’. In short, simple sum M2 is clearly a “faulty monetary statistic”!

Note, in the chart depicting money growth, that Divisia M2 growth begins to rise towards the end of the sample while SSM2 growth doesn´t change. You might be curious about what happens next to inflation.
Before satisfying your curiosity, from now on I´ll be using the broadest measure of the Divisia Monetary Index, Divisia M4 (for the sample above, Divisia M2 and Divisia M4 growth are quantitatively very similar).
Note that after the dashed line, and despite the prior increase in money supply growth, inflation falls!
The next chart “solves” the mystery. Note that the increase in money supply growth is not sufficient to offset the fall in velocity growth. In other words, the increase in money supply is not sufficient to satisfy the increase in money demand (fall in velocity). Or, despite the rise in the money supply, monetary policy was tightening!
Also, from September 1984 to December 1986, the FF rate fell from 11% to less than 6%. But monetary policy was not loosening!

The so called “Quantity Theorists”, therefore, have to change their definition of the money supply (M) and abandon the assumption that velocity (V) is stable.
The other side of the ledger, the “Phillips Curvers”, are also “dumbfounded”, beginning with the Fed itself. This quote from “Why the Federal Reserve needs a new plan” is illustrative:
A year ago, as U.S. inflation began to accelerate, the Fed (and many economists, including me) argued that soaring prices were transitory — the result of supply-and-demand disruptions caused by the covid-19 pandemic and subsequent lockdowns. The Fed reacted too cautiously as prices picked up and was too slow to raise rates.
Within months, inflation raced to 40-year highs, and the Fed was playing catch-up. In less than a year, rates have now jumped 4.5 percentage points, and Fed Chair Jerome H. Powell has warned of the “pain” that would be inflicted on ordinary Americans, an indication that rate hikes would lead to job losses.
The guiding model for this approach is the Phillips Curve — discovered by 1950s economist A.W. Phillips, whose work noted a trade-off between unemployment and wage inflation that could spill over into broader price inflation.
There is an appealing logic to this. Wages and benefits are the single-largest cost for most businesses, so a tight labor market drives costs up and gives rise to inflation. Thus, the best way to fight inflation is to hike interest rates to slow the economy until unemployment rises sufficiently to bring prices back down again.
But this isn’t what has happened. Rates have gone up and inflation has slowed, but the labor market remains tight, despite some layoffs. Even after all of last year’s Fed rate hikes, the unemployment rate announced Friday is at a 54-year low of 3.4 percent. As a result, the Fed looks confused, unsure about what is driving key economic indicators…
The restoration of low inflation without the pain of mass job losses would be welcome, of course. But it would also present a conundrum. If the whole Phillips Curve thesis is in doubt, then the basis for Fed decision making is in doubt, too. And if the labor market doesn’t explain inflation, then what does? The Fed is mandated with managing inflation and employment, so it’s not a good look to be wavering on these key questions.
No wonder there´s a generalized feeling of confusion. This confusion has even “brought together” monetarists and “Phillips Curvers” in their forecasts, with both predicting a (possibly deep) recession in the near future.
Let´s use the framework I illustrated before, which considers the money supply as given by the Divisia M4 index and its associated velocity (the inverse of money demand).
The chart below illustrates the period from January 2020, just before C-19 hit, to February 2022, just before inflation began to ease.
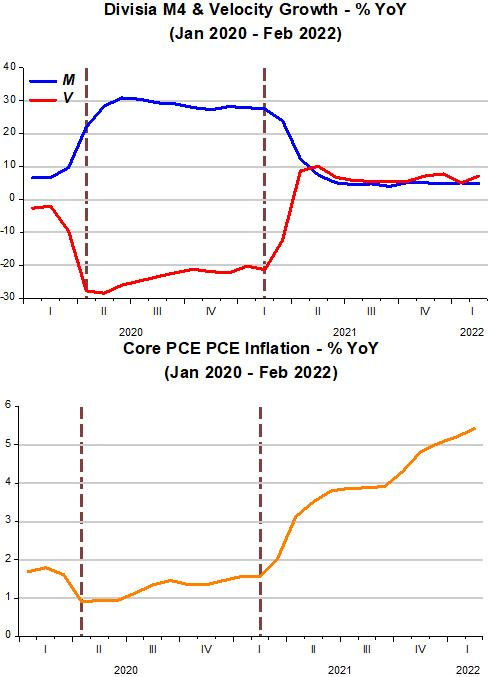
When C-19 hit, there was a sudden and deep drop in velocity (a “dash for cash”). Money supply reacted quickly but initially insufficiently to offset the fall in velocity. Inflation initially fell.
Between the two dash bars, while velocity rises slowly, money supply falls “meekly”, so inflation rises “gently”.
To the right of the second dash bar, initially velocity rises strongly while money supply falls less “eagerly”, so inflation “takes off” and keeps rising while both money supply and velocity increase at a stable and equivalent rate.
Maybe pandemic-associated disruptions enhanced the rise in inflation (even of the core variety) but the main driver was monetary in nature.
The next chart focuses on the recent period, covering March to December 2022. (March is also the month the Fed began to increases rates.)
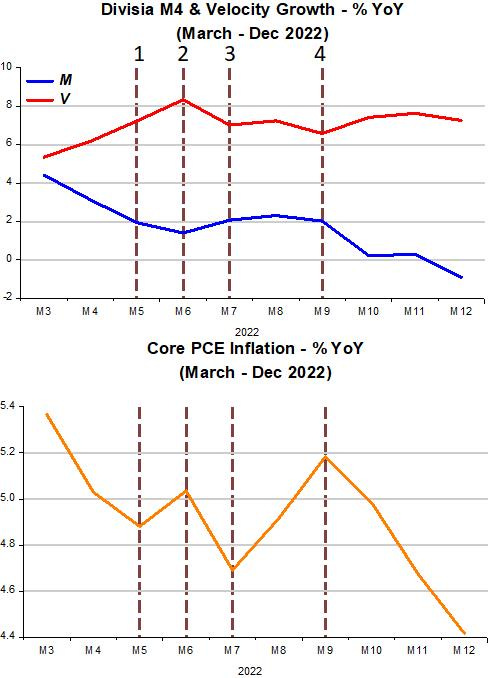
To the left of the first vertical bar, money supply falls by more than the increase in velocity, so inflation drops (note there´s no “long and variable” lag between the “tightening” of policy and the effect on inflation!),
Between bars 1 & 2, the opposite occurs, with money supply falling less than the increase in velocity. Between bars 2 & 3, money supply barely rises but velocity falls and so does inflation.
Between bars 3 & 4, with both money and velocity rising at a stable rate, inflation “kicks up”. But after that, while velocity growth doesn´t change much, money supply growth falls significantly, even turning negative. The outcome is a significant drop in inflation.
To people like Steve Hanke, who look only at money supply (even if at the “defective” measure of money), just like “too high” money growth spells inflation, negative money growth spells recession.
To be able to say more, I have to expand the framework to include, in addition to inflation, real output growth, but instead of considering them separately, I consider them together and call the sum of inflation and real output growth “Nominal Aggregate Spending” or NGDP growth.
With that we get the equation of exchange MV=PY or, in growth form m+v=p+y. To get the “Quantity Theory of Money” (QTM) the usual assumption is that V is “constant” (or v=0). But we have shown it isn´t.
I prefer to look at m+v=p+y as a “Thermostat” (see Friedman´s The Fed´s Thermostat). In this analogy, NGDP (p+y) is the “inside temperature” that the Fed strives to stabilize, by offsetting changes in v (the “outside temperature”) with changes in m.
The previous chart, then, becomes:

At 9.5% NGDP growth, the “inside temperature” was running too high. So the “thermostat” (m) has to be “set” so as to “decrease the inside temperature”. Given that the “outside temperature” (v) is running at around 7%, to dial down the inside temperature to a “sustainable” 4% -5% rate, money growth has to go negative!
In that sense, negative money supply growth is not a harbinger of recession!
Why did we have nominal stability (stable NGDP growth) during the 2010s? That was due to the fact that the “thermostat” was working just fine (the problem was with the Level that the Fed set for the inside temperature, but I leave that aside). The charts below illustrate.

The “magic” of having nominal stability is that it underpins real stability! Nothing like a well-functioning thermostat to provide overall “comfort”.
I would be much more sanguine about the near (and not so near) future if the Fed thought more explicitly about overall nominal stability instead of concentrating almost exclusively on its inflation component.
As the chart below indicates, during the 2010s, the level of velocity was relatively stable. As the chart above shows, this was reflected in small oscillations in velocity growth, requiring “small” adjustments in the thermostat (money growth) so as to keep the inside temperature (NGDP growth) stable.

After the hit to velocity of C-19, velocity has been rising back to its previous level. For the past several months, it has been growing at a rate close to 7% yoy. If it maintains that “speed” going forward, money growth will have to fall by 2% - 3% in order to keep NGDP rising at the 4% - 5% rate consistent with achieving nominal stability.
The desired level of velocity, however, may have shifted down, In that case, velocity growth will taper off soon and so money supply growth may have to turn positive again and then fluctuate offset the fluctuations in velocity around its new lower stable level.
It believe it´s possible to achieve a “soft landing”. The Fed´s mindset, however, is the major barrier to that outcome.
For a reflection on my comment “the problem was with the Level that the Fed set for the inside temperature”, I leave with this thought from Tim Lee.
Timothy B Lee writes in Workers are enjoying the tightest labor market in decades:
Still, it’s remarkable how quickly the economy rebounded from the April 2020 low point. It took less than two years for the prime-age employment to population ratio to rise from less than 70 percent in April 2020 to 80.1 percent in March 2022.
In contrast, it took a full decade for this measure to rise from 74.8 percent in December 2009 to 80.6 percent in January 2020. If the recovery of the 2010s had been as robust as the post-COVID recovery, we would have returned to the previous peak eight years earlier—in 2011 rather than 2019.
Let's see Divisia Aggregates explain the GFC?
I don't see the predictive value of Divisia M4. It looks ex-post not ex-ante. There is no "Fool in the Shower". Contrary to Powell and Greenspan et al., the distributed lag effects for M*Vt has been a mathematical constants for > 100 years.
Money flows don't show a recession in 2023, but there' a likely downdraft in the 1st qtr.