
Barkin "barks" about the 1970s
Barkin "barks" about the 1970s
The "lessons of the 1970s" are not the ones he imagines
Politico has done a piece on Richmond´s Fed president Thomas Barkin:
Thomas Barkin, much like his fellow Federal Reserve officials, doesn’t want to relive the 1970s.
Barkin sits on the central bank’s rate-setting committee as head of the Richmond Fed, where he participates in the debate over how much more policymakers will need to do to bring down inflation to their 2 percent target, now that prices are beginning to cool. Even as officials look to former Fed Chair Paul Volcker as a model for staying resolute in the face of high inflation, Barkin says the goal is not to face the same repeated surges in inflation that Volcker did.
“The lessons of the ’70s couldn't be any clearer: that if you let up on inflation too soon because you’re worried about the broader economy, then it comes back again stronger, and requires you to do even more damage to get it under control the next time,” the former McKinsey executive said in an interview Monday at the Fed board’s headquarters in Washington.
First, a correction: As the chart indicates, Volcker did not face repeated surges in inflation! When Volcker took on the Fed´s helm in August 79, inflation was on the rise. One year later it peaked and then travelled south throughout his tenure!

Let´s look at the “lessons of the 1970s”. The chart illustrates the behavior of inflation during the decade.
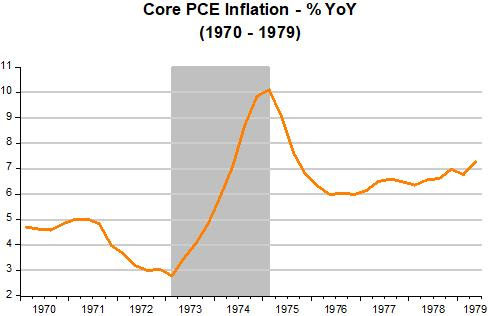
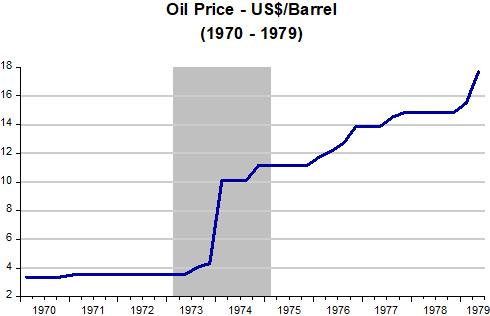
The fall in inflation in 1971 - early 1973 is mostly the result of the price and wage controls that were implemented. When they began to be scaled back, the oil shock happened, with oil prices more than tripling over a short period. That´s a clear example of a supply shock. In the Dynamic AS/AD framework what´s happening is that the AS curve shits strongly up and to the left so that inflation increases “majestically”.
The next chart illustrates the Fed´s reaction.
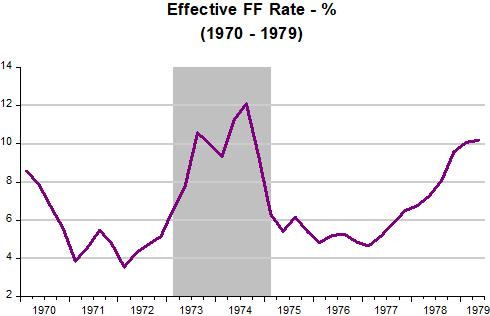
While the Fed doubled rates very quickly, it than halved them even more quickly. Maybe that´s what behind Barkin´s comment that “..if you let up on inflation too soon because you’re worried about the broader economy, then it comes back again stronger, and requires you to do even more damage to get it under control the next time”. Soon inflation began to slowly rise and the Fed had again to step on the “brake”.
Now I look at the 1970s from the “thermostat” perspective (for details, see here). I look at the equation of exchange MV=PY in growth form m+v=p+y. Here, p+y (or NGDP growth) is the “inside temperature” the Fed wants to control (for example, allow it to rise at a stable rate). v is the “outside temperature” (the inverse of money demand that can be, according to Friedman 1971, “whatever people want”. m is the thermostat, under close control of the Fed and “dialed” up or down in order to offset changes in v (“outside temperature”) so as to keep NGDP (“inside temperature”) rising at a stable rate.
As the chart for the 1970s below indicates, the thermostat was most of the time “dialed -up” to raise the “inside temperature” (NGDP growth). In other words, money supply growth was always exceeding money demand growth (the inverse of velocity) to the extent that NGDP growth was usually on a rising trend.
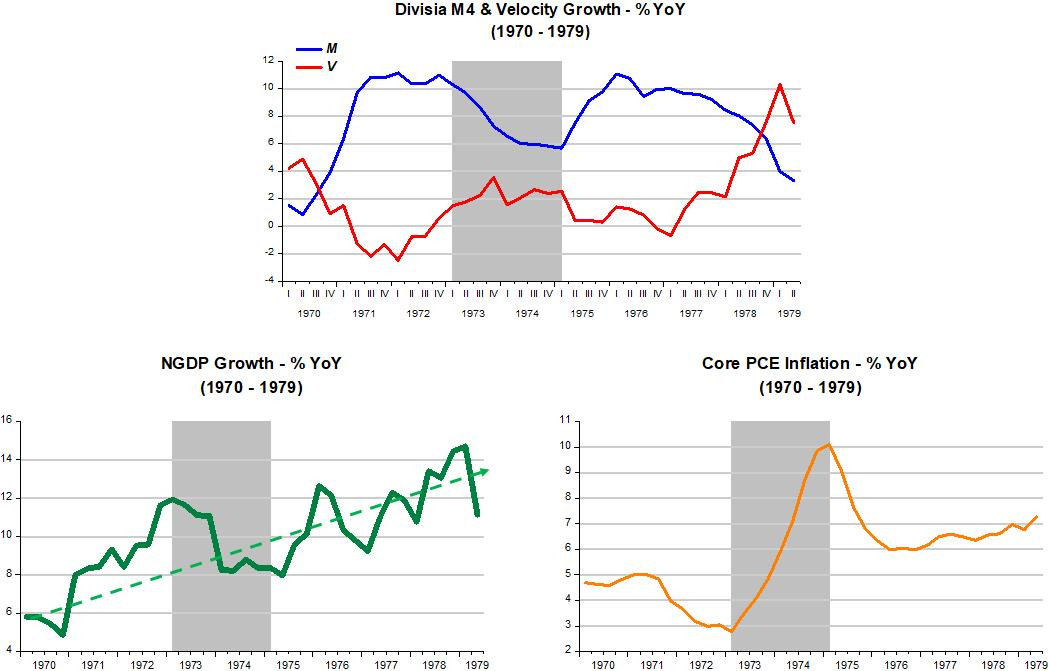
Note that in the early part of the decade, money supply growth much more than compensates the fall in velocity (increase in money demand) so that NGDP growth rises very quickly. Inflation, nevertheless, drops, reflecting the wage & price controls put in place in August 1971 and the robust recovery in real output growth following the 1970 recession.
The shaded area indicates the oil shock of 1973-74. Interest rates increase at a gallop but so does inflation (after all the policy lags are “long & variable”). That doesn´t seem to be the case if you look at how the thermostat worked. While velocity growth remained stable, money supply growth was significantly constrained. While that may have tempered somewhat the rise in inflation, it certainly dragged real output growth even lower! No lags here!
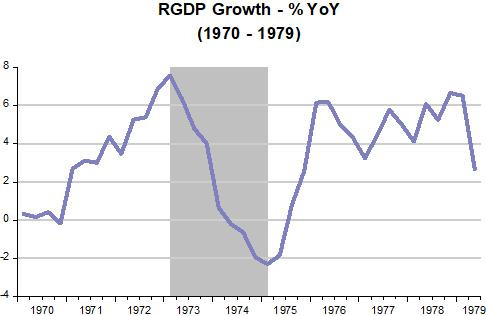
In short, the lesson of the 1970s is not that the Fed let up on inflation too soon, but that it adopted a monetary policy the outcome of which could not be anything other than higher inflation (irrespective of how it fiddled with the FF rate).
Moving on, almost immediately after taking over as Fed Chair, Volcker introduced what came to be know as ‘Monetarist Experiment’. As the NYT put it as soon as the ‘experiment’ ended:
Mr. Volcker had an excellent reputation in financial circles, and was known for his conservative, independent thinking. But no one in the Administration appreciated the degree of that independence. In October 1979, he instituted a major change in Fed policy. He abandoned the long-held policy of supporting a given interest-rate level through purchases and sales of Government securities. In its place, he applied a monetarist theory that advocated the setting of strict targets to control the supply of money while letting interest rates float up and down within a wide band.
And as William A Barnett wrote in his edited book “The theory of Monetary Aggregation”:
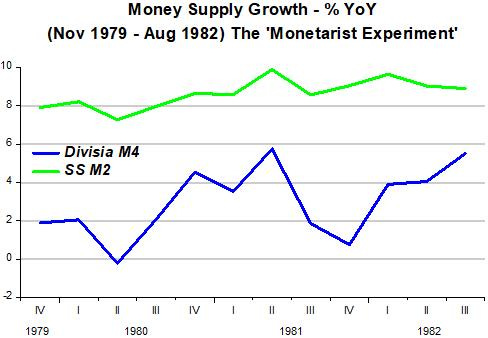
The ‘Monetarist Experiment’ of November 1979 to August 1982
…That experiment resulted in a serious recession, despite the fact that the behavior of the simple sum monetary aggregates during the period indicate an intent by the Federal Reserve to produce a gradual disinflation rather than a severe disinflationary shock.
I was on the staff of the Federal Reserve Board in Washington, DC from July 1973 to December 1981. As a result, I had more than average exposure to what led up to the ‘monetarist experiment,’ and I was a personal witness to many of the activities at the Federal Reserve during most of that period. Without unnecessarily getting into the controversies about what happened at the Federal Reserve during the ‘experiment,’ I do wish to observe that the data itself tells a very enlightening story…
While during the last few years of the 1970s, all monetary aggregates rose at double digit rates, during the ‘monetarist experiment’ there was a “monster” difference in the behavior of Simple Sum (M2) and Divisia M4. The chart illustrates.
While SSM2 grew on average around 9%, with little variation, Divisia M4 rose on average only around 3% with considerable variation.
With SSM2 growing at a robust but stable rate, the farthest thing from monetarists minds was the depth of the recession that began in the third quarter of 1981 and extended to the last quarter of 1982. The next chart shows that the interplay between Divisia M4 and Velocity growth (or the workings of the thermostat) fully explains that outcome, in addition to the behavior of inflation.
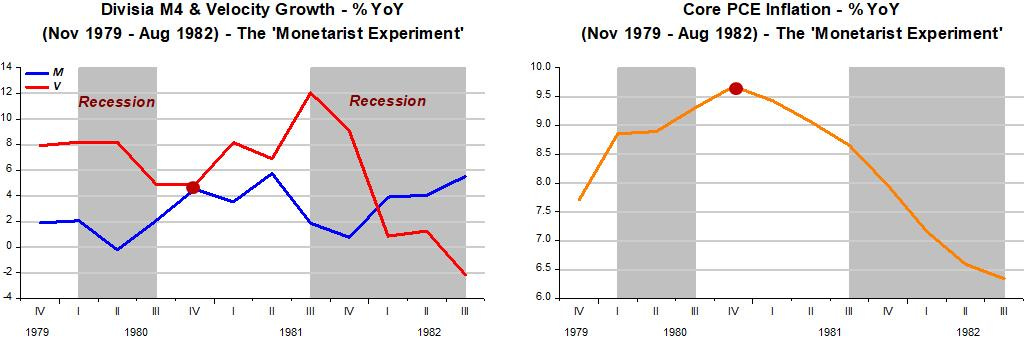
The rate of unemployment ballooned, as expected given the drastic reduction in NGDP growth and the associated recession. However, to the “Phillips Curvers” and to those that believe inflation is a “Price Phenomenon” (like the price of oil or bad/bountiful harvests) the ‘experiment’ was a “painful disaster”.

As the linked above NYT article puts it:
It is timely to assess the effects of the monetarist experiment during the Reagan Administration, which supported the Fed's tight money policy.
The major success has been a decline in the inflation rate. The rate of consumer-price inflation has dropped 7 percentage points since January 1981. But conventional economic analysis indicates that the recession induced by the high interest rates has been responsible for only about one-half of the decline in the rate of inflation. Increases in unemployment of 1 percentage point historically have been associated with declines in the inflation rate of about 1 point.
Accordingly, the rise in unemployment from 7.4 percent to 10.1 percent has led to only about a 3 percentage point decline in the underlying rate of inflation. The balance of the decline is attributable to extraneous factors - a softening of the tight world oil market and bountiful harvests that have dampened food-price inflation. Indeed, one recent Chase Econometrics study found that virtually the whole drop in inflation was due to such uncontrollable factors.
The monetarist policy has had a far greater negative impact on economic growth and unemployment than it has had a positive impact on inflation.
To call 9% M2 growth “tight money” is a stretch! What happened was that the Fed was following faulty monetary statistics! In that case it could prove wise not to bother about money because it will lead down the wrong path!
However, what happened in the aftermath of the ‘monetary experiment’ gives us hope. By the end of Volcker´s stewardship in early 1987, the economy had stabilized and for the next 20 years we had what came to be called the “Great Moderation”, characterized by mostly good monetary policy (reflected in a well-functioning thermostat) that gave us stable NGDP growth, low and stable inflation, robust and stable RGDP growth and falling/low unemployment.
There were a couple of moments that “hiccups” were experienced, mostly the result of the Fed´s “concern” with “low” unemployment leading to inflation (the Phillips Curve mentality).
Then, in mid-2007 the Fed lost its “magical touch”. Monetary policy was tightened considerably, despite the very big drop in interest rates, with the FF rate reduced from more than 5% to close to zero. The “thermostat” malfunctioned so that NGDP took a dive (before only partially recovering), unemployment climbed a mountain (before slowly coming down) and inflation remained most of the time significantly below target. The recovery was never completed, with the “thermostat” keeping the “inside temperature” (NGDP level and growth) at a “cooler” than previously temperature over the next decade. No wonder the “secular stagnation” view was revived!
The post C-19 story, applying the “Thermostat” framework, is told in my previous post.
Vi is a “residual calculation – not a real physical observable and measurable statistic.” Income velocity may be a “fudge factor,” but the transactions velocity of circulation is a tangible figure.
I.e., income velocity, Vi, is endogenously derived and therefore contrived (N-gDp divided by M) whereas Vt, the transactions’ velocity of circulation, is an “independent” exogenous force acting on prices.
Vi has at times moved in the opposite direction of Vt for considerable periods of time.
"The only relevant test of the validity of a hypothesis is comparison of prediction with experience." – Nobel Laureate Dr. Milton Friedman
From the standpoint of the entire payment’s system, from the standpoint of the economy, commercial banks never loan out, and can’t loan out, existing funds in any deposit classification (saved or otherwise), or the owner’s equity, or any liability item. Every time a DFI makes a loan to, or buys securities from, the non-bank public, it creates new money - demand deposits, somewhere in the payment’s system. I.e., deposits are the result of lending and not the other way around.
The S&L crisis was the May 1980 predicted result. The GSEs were also predicted in May 1980 to supplant Savings and Loan Associations' lending. Bank debits went negative for the first time during the 4/1991 - > 11/1992; the 7/1990 –> 3/1991 recession.
I.e., the DIDMCA destroyed the thrifts, which expeditiously invested savings.
So, the "Great Moderation" was due to an increasing volume and increasing proportion of bank deposits being saved.
The GFC was also predicted in May 1980, due to Greenspan's 40% decline in required reserves (the decline was predicted). Leland Pritchard is the smartest man that ever lived.