
"All the light we cannot see"
"All the light we cannot see"
Squint hard and you´ll see it through the workings of the "thermostat"

I “glimpsed” the light many years ago, when Nick Rowe “opened the curtain”. In 2012, he made a plea writing:
“Why are (almost all) economists unaware of Milton Friedman's thermostat?”
I know I'm right in saying that Milton Friedman's thermostat is an important idea that all economists ought to be aware of. And I'm pretty sure I'm right in asserting that almost all economists are unaware of this important idea. Am I wrong? Are you aware of this idea? Maybe under some other name?
…This really bugs me.
Milton Friedman's thermostat has got nothing to do with Monetarism, or even macroeconomics. Or rather, Milton Friedman's thermostat is an idea that has very broad application, and has nothing in particular to do with Monetarism or even macroeconomics. Or even economics.
If I had to categorise where this idea belongs, I would say it is an idea that belongs to applied econometrics. But, as far as I can see, I would say that applied econometricians are as unaware of this idea as any other economists, even though they have the greatest need to be aware of this idea.
…And it's not even a very complicated idea. You can explain the gist of it using words and simple examples.
But it's a really really important idea. Both theoretically important, and practically important.
So why does such an important idea need to keep on being reinvented? Why are (almost all) economists unaware of this idea?
It's not as though Milton Friedman were some no-name economist that everybody ignored. Every economist is very aware of lots of Milton Friedman's other ideas. Those other ideas are taught to all economics students. Why not this idea?…
A couple of years earlier (2010), he wrote: “Milton Friedman´s Thermostat”. The gist of it is that:
If a house has a good thermostat (Central Bank), we should see no correlation between the inside temperature (NGDP) and the amount of oil burned in the furnace (M).
We should also see no correlation between the outside temperature (V) and the inside temperature (NGDP).
And we should see a strong negative correlation between the outside temperature (V) and the amount of oil burned (M).
In a comment elsewhere at the time he says:
"The contrast between the periods before and after the middle of the 1980s is
remarkable. Before, it is like a chart of the temperature in a room without a
thermostat in a location with very variable climate; after, it is like the temperature
in the same room but with a reasonably good though not perfect thermostat, and
one that initially is set to a gradually declining temperature. Sometime around 1985, the Fed appears to have acquired the thermostat that it had been seeking the whole of its life."
As the pictures below show, the contrast is stark.
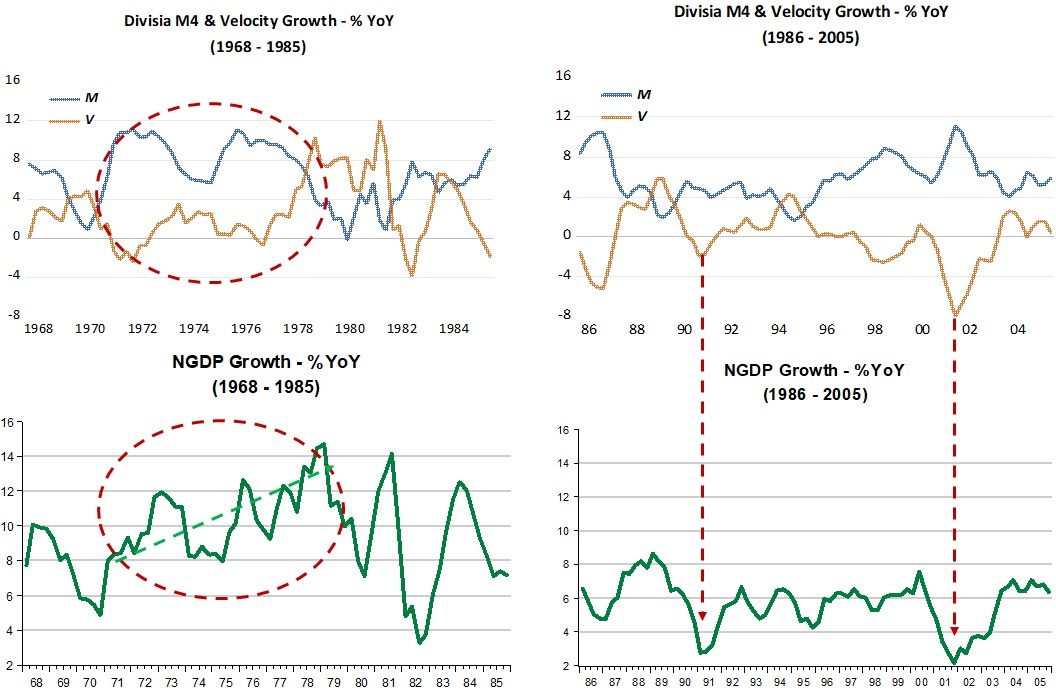
On the LHS chart, notice the area within the circle. While for part of that time the ouside temperature (V) is not changing much, there´s a lot of oil being burnt in the furnace (M). No surprise, then, that the inside temperature (NGDP) is consistently rising. Notice also then when the outside temperature (V) rises, the amount of oil being burnt in the furnace (M) only drops slowly, so the inside temperature (NGDP) continues to rise!
Outside the circle, coinciding with Volcker taking over at the Fed, V swings wildly, while M just doesn´t keep up, resulting in also wide swings in NGDP growth.
Moving to the chart on the right showing how things evolved after 1985 through 2005, mostly coinciding with Greenspan at the helm of the Fed, we notice that the thermostat began to be better “calibrated” to bring the inside temperature (NGDP) to a lower and more “pleasant” level. The Fed´s control of the thermostat (or the amount of oil being burnt in the furnace (M)) is still “deficient” because soon, while V falls, the amount of oil burnt in the furnace (M) does not increase sufficiently and the inside temperature (NGDP) drops.
When that mistake is corrected, the Fed does a good job of keeping the inside temperature (NGDP) stable all through the end of the 1990s, when another mistake happens, with not enough oil (M) being put in the furnace to compensate for the drop in the outside temperature (V).
Why did those mistakes happen? The first could be “justified” by the Fed´s lack of “experience”. But the second mistake happened after several years of successful “practice”.
It´s always useful to to analyse why things went wrong. My preferred candidate is the conventional assumption that “low unemployment is a cause of inflation” (or the Phillips Curve mindset).
The charts below show that both mistakes were made when unemployment fell to “low levels”. Note that inflation, in particular during the years the thermostat was working well, was falling throughout as was the rate of unemployment. Unfortunately, the view that low unemployment is a cause of inflation makes for terrible economics!

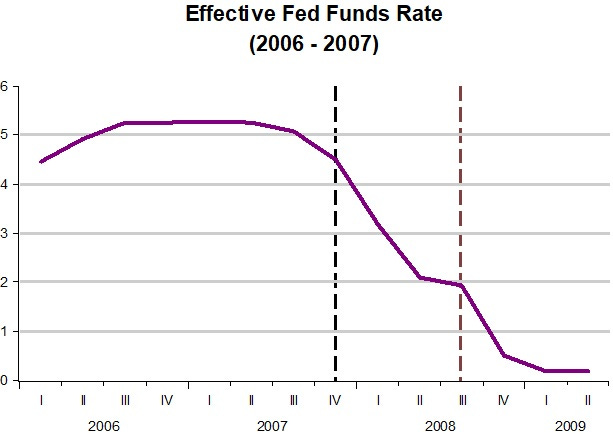
The next period surveyed shows how we went into the Great Recession.

Since taking over at the Fed in January 2006, Bernanke set off to “cool” the economy, with the room temperature (NGDP) slowly dropping. At the very end of 2007, the outside temperature (V) began to fall significantly. The Fed barely put any coal in the furnace, with the result that the inside temperature dropped faster.
Around mid-2008, with the Fed showing it was “lost”, uncertainty rose when the financial system became “wobbly”. The outside temperature (V) dropped forcefully. Little coal (M) was placed in the furnace, and was quickly retrieved once V stopped falling and edged up. With that, the room temperature (NGDP) fell below “freezing”!
Initially, inflation was too “stunned” to move, but when it became clear that the Fed was set in “freezing-up” the economy, inflation “dived”.

Not having “lived” during the period that the Fed´s thermostat was efficiently used, Bernanke tried to “manually” adjust the “temperature” by using the conventional interest rate instrument. Despite interest rates being significantly lowered, the room temperature kept falling. To “explain” the lack of success of the “easing” of monetary policy, it was argued that the unobservable (and hard to estimate) “natural rate of interest” had fallen even more, so even a zero rate was consistent with a “tight” monetary policy!
The next 10 years, from the end of the Great Recession to just before C-19 hit, the Fed once again “found” the thermostat. Only this time the Fed decided to keep the room temperature permanently lower.

This is clearly seen in the levels chart below. The economy never recovered from the Great Recession, with the room temperature remaining permanently lower!

In mid-09, as the GR ended, the outside temperature (V) increased, but some coal (M) was taken off the furnace, so the room temperature did not rise as much. From that point on, the room temperature was kept relatively stable at this lower level. Some “Fedfretting” about “normalizing” rates and “tight labor market” around 2016/17 contributed to “dip” the room temperature. Overall, however, the thermostat worked fine!

And then, C-19 hit. I´ll look at the past three years in stages, and the “light will shine”! The first stage covers the first year of C-19. The outside temperauture (V) fell precipitously. Coal (M) could not be thrown into the furnace fast enough, so the room temperature (NGDP) fell hard.
Very quickly, however, enough coal (M) was fed into the furnace, even while the outside temperature (V) stopped falling, allowing the room temperature (NGDP) to rise quite quickly.

In fact, one year after taking the C-19 hit, the level of the room temperature (NGDP) was back quite close to the level path that prevailed before C-19 hit. Inflation, which had fallen with the drop in the room temperature, slowly picked up.

The relevant observation here is that those that already in Spring 2020 were fretting about the record increase in money supply growth, and decrying that “massive” inflation was just around the corner (allowing for the conventional lags), were completely wrong. The thermostat view tells us that monetary growth was exactly what the “doctor ordered”, definetely avoiding a second Great Depression!
It appears that at that point, the Fed got “excited” and “forgot” to look at the thermostat, allowing the outside temperature (V) to rise without sufficiently reducing the amount of coal (M) in the furnace. The inside temperature (NGDP) rose strongly!

Below we see that the level of NGDP surpassed the trend path it was on following the Great Recession, resulting in inflation rising above target.
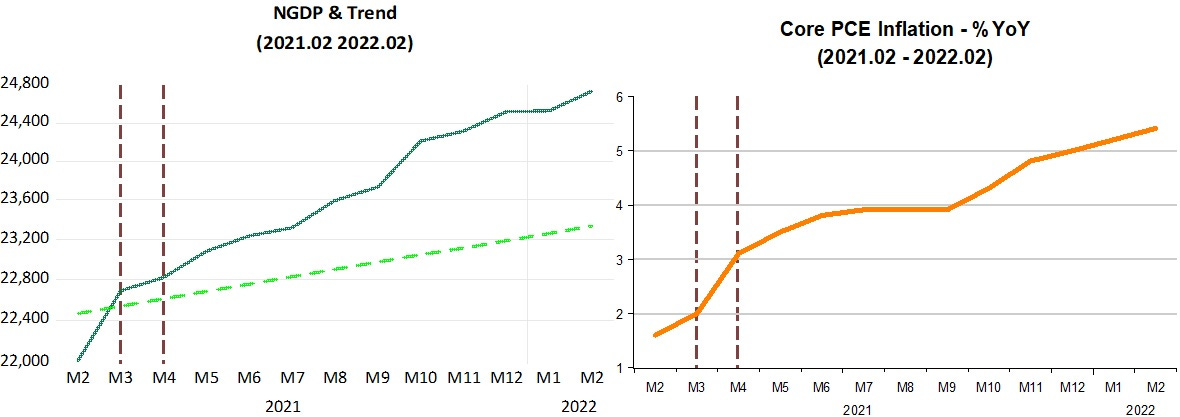
After mid-2021, with V and M rising together at a stable rate, the inside temperature (NGDP) remained “stably hot”!
While in the first phase monetary policy was adequate for the economy to regain Nominal Stability, in the second phase monetary policy was excessively expansionary.
Phase 3, however, indicates that the Fed is back trying to get control of the thermostat, and since August 2022, it is trying to bring the room temperature down, by generally taking out more coal (M) from the furnace than is necessary to offset changes in the outside temperature (V).
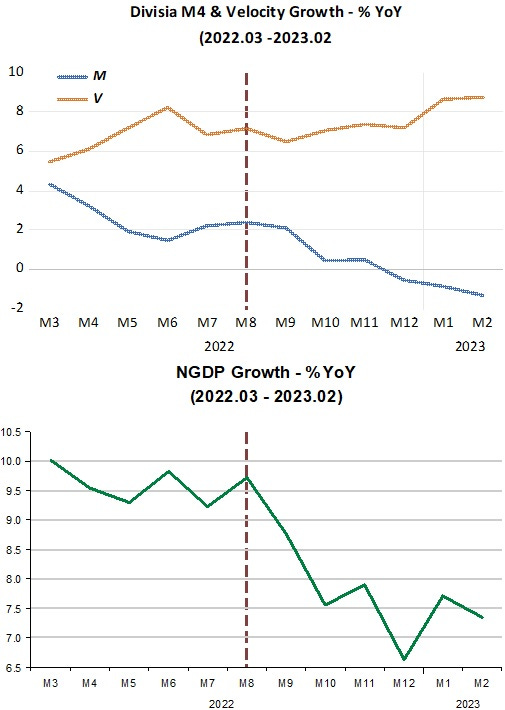
Now, those that misunderstand monetary policy, by not looking at it through the light shone by the thermostat, see money growth going negative and decree that the Fed has gone from overly expansionary to overly contractionary and that soon, inflation will fall below target and we all will “enjoy” a recession!
The Fed has been, if anything, only “lightly” contractionary. The end goal is to bring the inside temperature (NGDP growth) down to between 4% and 5%. Depending on how the outside temperature (V) behaves, now that the banking shock (importantly impacted by the Fed´s fiddling with interest rates) has maybe jostled it, if money growth has to go deeper into negative territory, so be it! That certainly doesn´t mean a recession is on the cards. If the thermostat works properly a “soft landing” will come to pass.
Barnett's Divisia aggregates does not explain velocity. Therefore, it does not explain N-gDp.
The FEB #s are out and show a contraction. N-gDp is still too high.
The 'thermostat' began to work because of the impoundment of monetary savings in the payment's system. Contrary to economists, banks don't lend deposits, deposits are the result of lending. That's why Dr. Philip George's equations worked.
With all due respect I wonder about the causation here. You use the NGPD and M data to derive velocity curves. How can you say that the velocity caused anything when it is not independently measured data? Velocity numbers just portray the ongoing, fluctuating disconnection between money supply and GDP. I agree that stable NGDP growth is a good goal for government inflation policy, but velocity is not an actionable data trend. It is just an explanatory concept after policy and policy's response occur. That's why central banks set interest rates nowadays, not money supply in their goal of stabilizing the economy.