
A simpler view of monetary policy
A simpler view of monetary policy
Unfortunately, for many, it does not equate to interest rate policy (nor, as monetarists ascertain, to money supply growth)

To begin with, some”inconsistencies”:
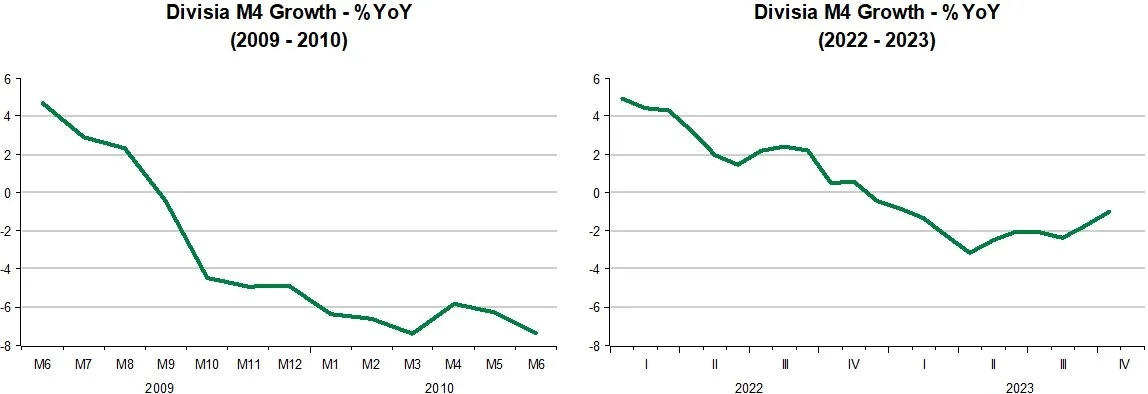
When the Great Recession ended in mid-09, money growth tanked. While the inflation talk was "loud", no one was predicting another recession. Now, money growth is falling by much less, but recession calls are widespread while “inflation talk” more muted!
A couple of examples: Charles Plosser, Philly Reserve Bank President, in 2008:
I am more optimistic about the outlook for 2009 and I expect we will see economic growth return to near its longer-term trend. But to prevent recent inflation from continuing(!) to plague the economy and to avoid a rise in inflation expectations, I believe the current very accommodative stance of monetary policy will need to be reversed, and depending on how economic conditions evolve, I anticipate that this reversal will likely need to begin sooner rather than later.
And six years later, we face the “sooner rather than later” again:
I would prefer that we start to raise rates sooner rather than later. This may allow us to increase rates more gradually as the data improve rather than face the prospect of a more abrupt increase in rates to catch up with market forces, which could be the outcome of a prolonged delay in our willingness to act.
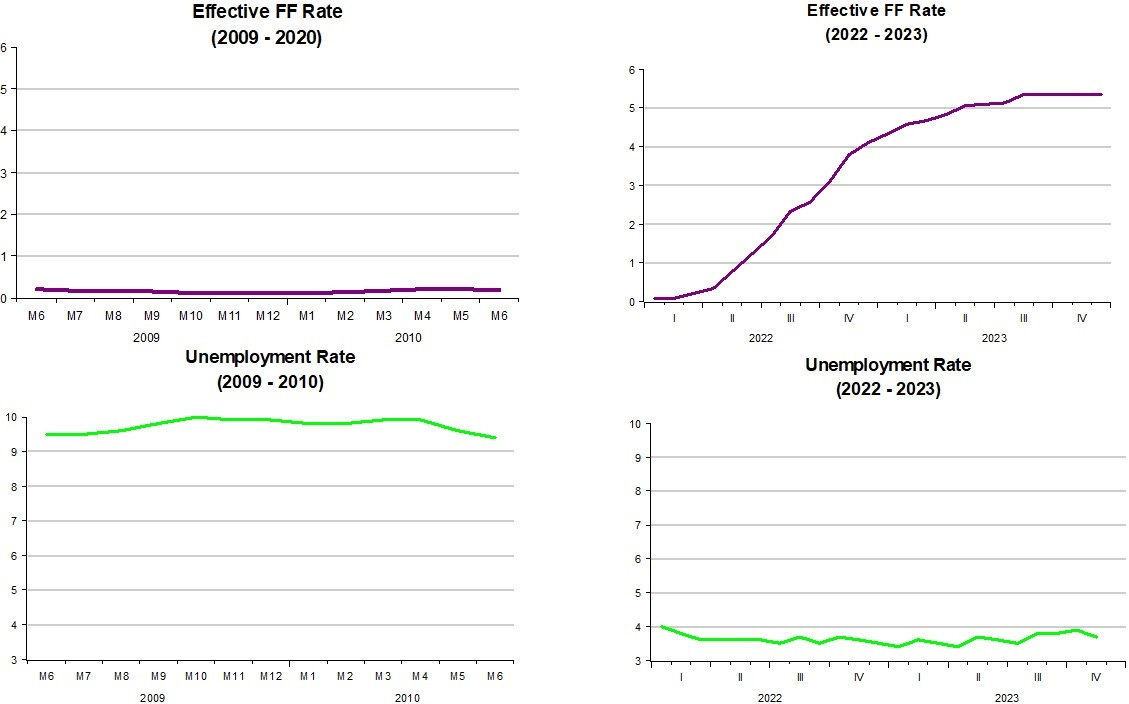
While throughout those 6 years inflation was “very low” (below target) and stable, the Fed Funds rate was “zero”!
In contrast, now, while inflation is falling steadily to target (by some measures already reached target), the FF rate has risen by more than 500 basis points.
To interest rates “enthusiasts” very low interest rates as in 2009-15 indicated monetary policy was “too easy” so that an increase in inflation was a palpable risk, the fast rising rates in 2022-23 would indicate that monetary policy was quickly tightening, so that the chances of a recession were rising fast.
In mid to late 2022, a recession in 2023 was almost a given. It remains so at the start of 2024:
Arturo Estrella:
For December, the 10yr-3mo Treasury spread continued to fall once more and averaged -1.31%, consistent with a 99.5% probability that a recession will start in 2024.
A view to which this provides a nice rebuke:

Some more “inconsistencies”:
If monetary policy was so "easy" in 2009-10, why was unemployment so high? If monetary policy is so "tight" now, why is unemployment so low?
Those “inconsistencies” may reflect the fact that interest rates are a poor gauge of the stance of monetary policy!
The money supply “enthusiasts” are also in a bind. Unlike interest rate “enthusiasts”, they were not worried about inflation in 2009-10 because the broadest measure of money supply (Divisia M4) growth was falling strongly. In 2020, also unlike interest rate “enthusists”, they predicted inflation was coming in the near future. Now, that broad money supply is falling, they join the interest rate “enthusiasts” and also make the recession call!
Tim Congdon 2023:
The essence of broad-money monetarism is, to repeat, that changes in the quantity of money, broadly defined, determine inflation. [note: broadly defined money to Congdon is simple sum monetary indeces like M3. For Divisia Indeces see Barnett]
Tim Congdon, also in 2023:
One of the most famous monetarist economists, Tim Congdon, adviser to the British government in 1993 and 1997, pointed out this year that the Fed, the ECB and the Bank of England are to blame for the high inflation they are suffering and warned that they are also responsible for the recessions that will come from the middle of 2023. In his opinion, “the amount of money in circulation should be in the control panel of the central bank. Otherwise, central bankers will be as dangerous as a citizen driving without a speedometer,” Congdon warned.
So, neither interest rate “enthusiasts” nor “classical monetarists” get it consistently right! And that´s simply because both interest rates and the broad measure of the money supply growth are very poor indicators of the stance of monetary policy!
To solve the “riddle”, let me add another element to the money supply growth charts that opened this post. The added element is velocity (the inverse of money demand) gowth.

In 2009-10, although broad money supply growth was falling (even turning negative), money demand growth was falling (velocity rising). The fall in money supply growth was necessary to avoid a sitution of excess money supply growth, which would lead to an increase in inflation;
In 2022-23, velocity was relatively stable, so that the fall in money supply growth indicated that monetary policy was tightening (in effect, becoming less easy than it had been in 2021).
So, while in the first case inflation does not increase (as imgined by people like Plosser, who only looked at interest rates), in the second case, inflation was falling because money supply gowth was becoming “less excessive” (that´s far from being contractionary as Congdon et al indicate)
By looking at what´s happening to both money supply and money demand, we can gauge the appropriate measure of the stance of monetary policy. That´s because, if money supply growth is adequately offsetting changes in velocity, from the equation of exchange nominal aggregate spending (NGDP) growth will be stable (after the adjustment to any initial imbalance has been made). The next charts show this happening.
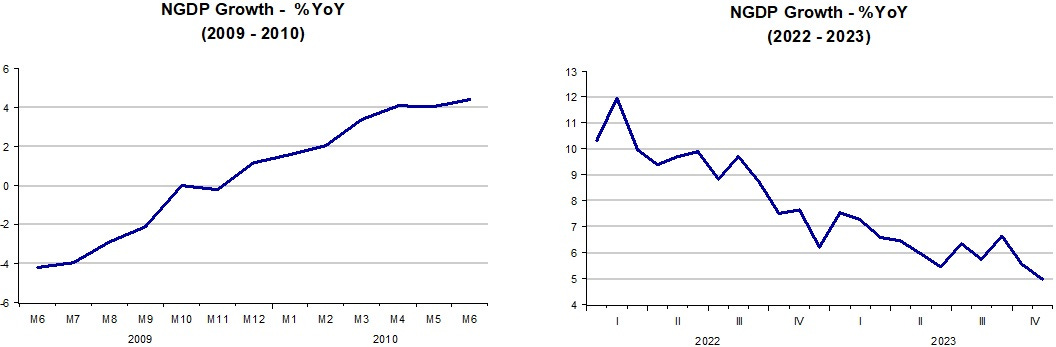
In 2009-10 monetary policy was “easy” enough to get NGDP growth to rise until it reached 4%, after which it remained growing at that rate for the rest of the decade (I will show that later). After being excessively expansionary in 2021, monetary policy became less “easy” in 2022 and has remained so in 2023. Going forward it remains to be seen if the Fed will manage to stabilize NGDP growth in the 4%-5% range, like it did in 2010.
If the Fed is succesful in doing that, a “soft landing” will be the most likely outcome (the most relevant risks are the geopolitical factors that may cause unwanted and hard to measure disturbances).
I conclude that NGDP growth is the best gauge for the stance of monetary policy. If it is rising, monetary policy is expansionary (or less tight). If it is falling monetary policy is tightening (or becoming less easy).
The next chart provides a view of the past 30 years for gauging the stance of monetary policy.
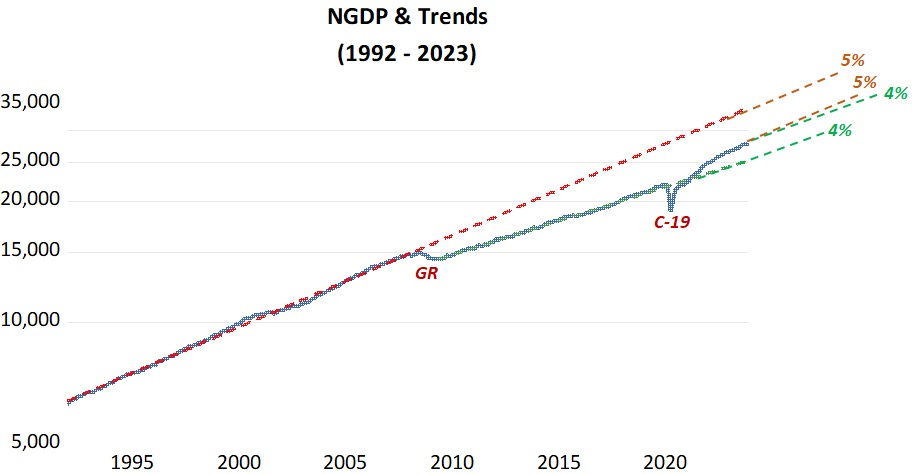
During the Great Moderation, before the “Great Recession” (GR), NGDP growth was on stable level growth path (5% yoy). The GR was the result of a mamoth monetary policy mistake, with the tightening of monetary policy so strong that NGDP growth turned significantly negative. In mid 2009, the GR ended because (as seen in the NGDP growth charts above), NGDP growth began to rise.
Note there was no “make-up” monetary policy expansion, with the Fed being content with keeping NGDP growth evolving along a stable but lower growth path (the 4% growth path I alluded to earlier).
When C-19 hit in early 2020, NGDP growth dropped sharply. That was not “Fed-made”, but C-19´s fault. The Fed was quick to take NGDP back to the previous level path, resulting in the shortest recession on record (just two months). But it didn´t stop when it reached the 4% level growth path, expanding monetary policy, thus provoking the strong increase in inflation experienced in 2021.
More recently, as observed in the NGDP growth charts above, NGDP growth is approaching the 4%-5% growth rate along a level path that´s between the pre-GR and post GR path. If it keeps NGDP growing along this new path, there will be no recession and no increase in inflation, and as a “bonus”, a part of the aggregate nominal spending lost in 2008-09, will be “recovered”. The waning of C-19 related supply disruptions, and if no significant negative supply shocks are experienced, real output will likely also evolve along a higher growth path.
One takeaway from this analysis is that the heated debates about when the Fed will begin to reduce the FF rate, or the still intense discussions about the likelyhood of a near-term recession are misplaced and unproductive. What matters for the overall economy is the degree of nominal stability the Fed manages to achieve.
Two questions
"What matters for the overall economy is the degree of nominal stability the Fed manages to achieve."
Sure. What does the Fed need to do (movement or non movement of any particular policy instrument) to achieve that?
Whatever mistakes in policy instrument movement may have produced the financial crisis (and I would like to know what they were) was the more fundamental cause of the GR not the failure to move instruments so as to return to 5% ngdp growth or re=create expectations of 2% CPE growth?
You start from the right framework - but use the wrong metrics. Income velocity can move in the opposite direction as the transaction's velocity.
Money demand during C-19 is best reflected in the composition of the money stock. There became as Shadow Stats pointed out: "a flight to liquidity", where the proportion of transaction accounts to gated deposits grew, increasing Vt.