
1970s, "you are always on my mind"
1970s, "you are always on my mind"
but even the 1970s evoke different experiences among countries

Pointers on the 1970s “mania”.
Larry Summers: The situation continues to resemble the 1970s, … mistakes of excessive demand expansion that created an inflationary environment. And then we caught really terrible luck with bad supply shocks from OPEC, bad supply shocks from elsewhere. And it all added up to a macroeconomic mess. And in many ways, that’s the right analogy for now.
Olivier Blanchard: Uncomfortably like the 1970s…and the only comparable episode to today, if any, is the episode that ended with the Volcker disinflation of the early 1980s.
Jim Bianco: Many say the Fed cannot print more oil or print more container ships. This is a reference to the supply shortages that are beyond the control of monetary policy.
This argument is not new. It was essentially the same argument made by Fed chair Arthur Burns in the 1970s. Back then the supply constraint was an Arab oil embargo contributing to inflation.
Excess demand due to monetary stimulus is a big part of the current inflation surge. History is repeating, with he same consequences, persistent inflation that Wall Street refuses to believe.
What “links” the present to the 1970s are the supply shocks that have so far permeated the 2020s! The Pandemic shock has now been enhanced by the War shocks. What I want to argue is that, although supply shocks inevitably lead to an increase in inflation, what determines how much inflation overall we get is still dependent on actions by the monetary authorities.
Interestingly, 10 years ago, Michael D. Bordo and Athanasios Orphanides edited, “The Great Inflation: The Rebirth of Modern Central Banking.” Robert Hetzel wrote a review, commenting on the different articles published. I highlight the following:
Given the Blinder-Rudd explanation of the Great Inflation that exonerates the Fed from any blame, the discussion of monetary policy in Japan and Germany is especially interesting.
Takatoshi Ito (“Great Inflation and Central Bank Independence in Japan”) contrasts monetary policy before and during the two inflation shocks of the 1970s, the first in 1973-1974 and the second in 1979-1980. He argues that expansionary monetary policy in the early 1970s had already created high inflation before the first shock. In the second episode, monetary restraint led to only a short-lived, moderate increase in inflation.
In a similar spirit, Andreas Beyer, Vitor Gaspar, Christina Gerberding, and Otmar Issing (“Opting Out of the Great Inflation: German Monetary Policy after the Breakdown of Bretton Woods”) credit a monetary policy, which started in the mid-1970s, with a firm nominal anchor for price stability as a source of nominal and real stability relative to other countries. They especially emphasize the role of money targets as a commitment device for aligning inflationary expectations with the goal of price stability.
And concludes his review with the following:
Macroeconomists cannot run controlled experiments, but they can do a much better job of identifying and elucidating the extraordinary range of experiments that central banks have delivered. The Great Inflation is a terrific example.
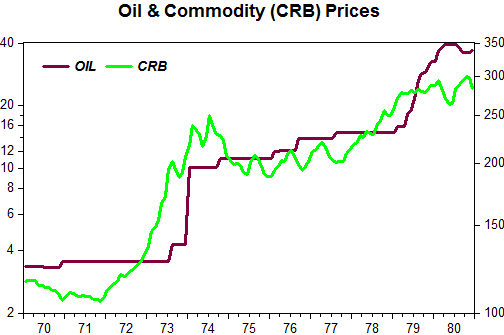
The chart illustrates the supply, or price, shocks that buffeted the world economy in the 1970s
The next chart depicts the behavior of inflation in the US, Japan and Germany.
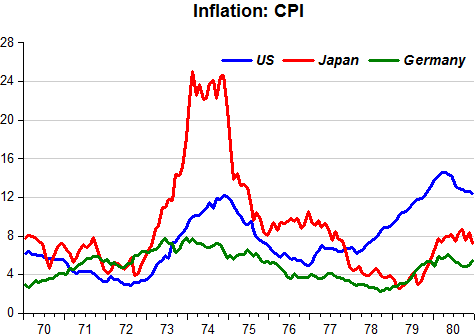
From the inflation chart, note that Japanese inflation took off at the time of the commodity shock so that by the time the oil shock happened inflation in Japan was already above 15%. Note also that the second oil shock in 1979 had little impact on Japanese and German inflation, in contrast with what happened in the US.
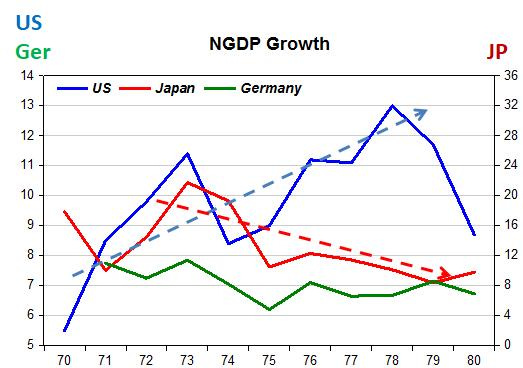
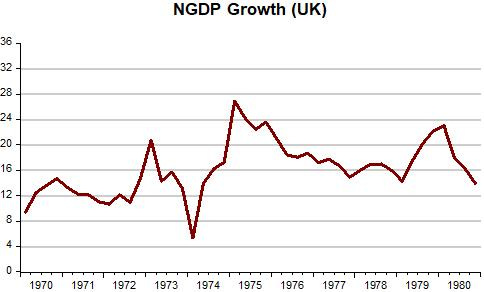
As the Dynamic AS/AD model indicates, the best alternative for a Central Bank facing supply shocks is not to go into a “tightening spree”, but to keep nominal aggregate demand (NGDP) on a stable path.
When we compare the behavior of monetary policy in the three countries, represented by the growth in NGDP, it´s not hard to see the reason Germany had the lowest inflation outcome and that by changing monetary policy Japan, unlike the US, mostly avoided the inflationary impact of the second oil shock.
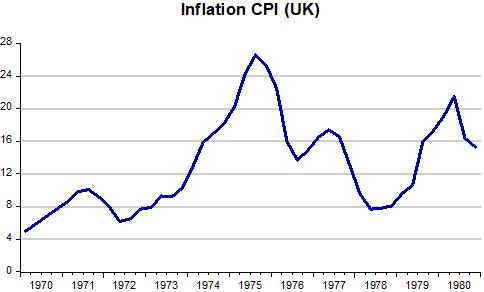
The charts for the UK provide additional confirmation on the dependence of overall inflation on the conduct of monetary policy, gauged by what´s happening to NGDP. (Note the scale in the chart for UK inflation is the same as the one for inflation in the other countries, while the scale on the NGDP growth chart is the same as the scale for Japanese NGDP growth).
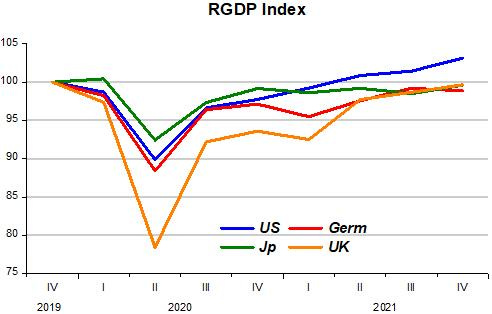
I have argued elsewhere that the Fed did a stellar job until mid 2021, after which it “over tipped” its hand (at least until Oct 21). This is reflected in the real GDP chart comparing our different countries, with the US showing the strongest recovery.
Going forward, given the supply constraints that will be with us for the months ahead, what´s the Fed´s best strategy. It´s certainly NOT repeating the 1970s and keep NGDP on a rising trend, which was ultimately what caused the high inflation of the time.
It could try to quickly reverse its “error” of last year, but that could lead to undesirable effects. My standing suggestion is that it keeps NGDP relatively constant in the coming months until NGDP “meets up” with the post great recession trend path.

But that means your advice boiled down to its essence is that we need a 5-6% drop in real GDP. Maybe more as inflation ramps. Maybe less as inflation reacts to your advice.