
The (inflation) stories people tell
The (inflation) stories people tell
Like in Heinz Tomato Sauce, there may be 57 varieties of them

I´ll be concerned only with measures of the CPI. I know that´s not the inflation measure that the Fed targets. But the inflation (directional) story both the CPI and PCE tell is the same, with their difference being wholly due to methodological differences in their calculation.
One important difference between them is the weight of the owners equivalent rent (OER) measure, that have a much heigher weight in the CPI. The OER is also the “villain” of my own story. It is also a “special villain”, because it is an “imputed villain” in the calculation of inflation!
Let me not get ahead of myself. There are several “types” of stories being told, and every month a “new chapter” is added, causing a lot of “chatter”.
There are the “scary” stories, such as the one that tracks inflation in the 1970s and “contemplates” that we may be travelling the same path at present. This story is illustrated below.
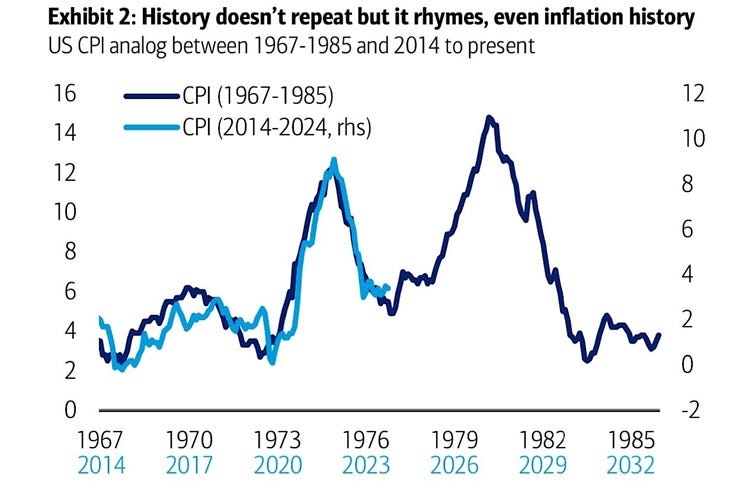
The “scary” story should be given no credence. It is “bollocks”, not worth my time to “criticize” it!
There is also the “Partisan” story. This is the one is the most frequently “cited” by the Fed. After “hearing” it, no wonder Powell says he´s not “confident” that inflation is on the road to target!
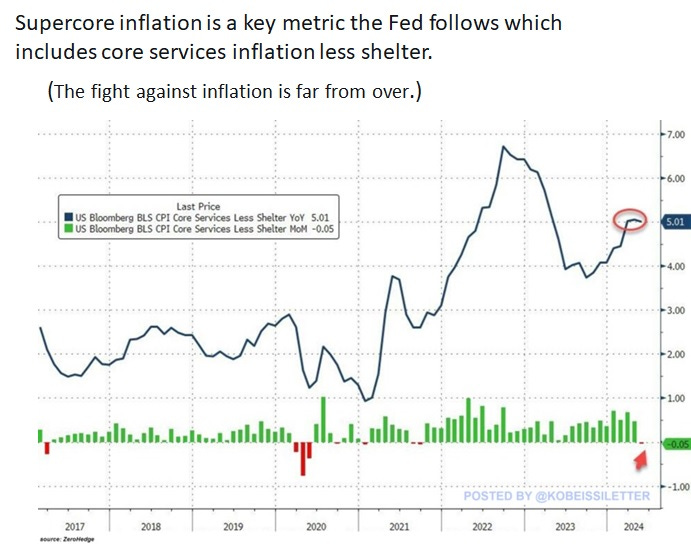
Powell should certainly be looking at other “stories”!
Then there are the “breakdown” stories, which seem to be the most popular. They breakdown inflation into monthly, 3 months, 6 months and 12 months. At each “breakdown”, they try to glean what will be the next step in the story or if the current “ending” (the curent 12 month “breakdown”) will change going forward.
To avoid overburdening the reader, I´ll just cover the 1 month & 12 months “breakdown” of the story.
The image below shows how it´s like to “read” the 1 month breakdown of the story. There are two versions of this “breakdown” of the story: One in which all “actors” are playing a “role” and the other when we take out the “villain” (and some of his “weaker” companions”), resulting in the CPI less shelter group.
Notice that it´s just like reading inside a car driving along a bumpy road, where your head (and eyes) move up and down sometimes more strongly and frequently. The “words” become very “wiggly”.
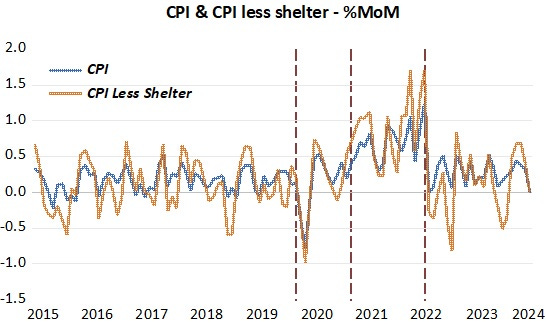
What´s rather funny is that when the “wiggle” is up, the feeling is “OMG” whe´re “doomed”. When the “wiggle” is down, the feeling is “need some more of those to become confident”!
The latest “wiggle” was down, but that became known only after the Fomc “ruled”, and since the previous “wiggle” was up, they revised up their expectations for the “end of the story for December 2024”!
The next image shows what it´s like reading the story inside a car travelling along a much smoother road. Much fewer and smaller wiggles and a lot more “direction” is gleaned from this breakdown.
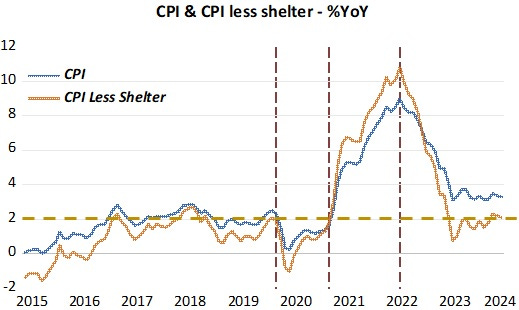
But note that overall, the chosen “breakdown” does not change the essence of the story. The vertical dotted lines show the moments when the “trend-status of the story” changes. Between the first and second vertical lines, there´s a large “down wiggle” in the one month break down, followed by postive “wiggles” to bring inflation up. As seen in the 12-month breakdown, inflation falls far below target but as the positive one month wiggles accumulate, the 12 month breakdown brings inflation back to target.
Between the second and third vertical lines, there is an upward trend in the 1 month breakdown of the story. This change in trend is more neatly observed in the 12 month breakdown. (Why inflation behaved the way it did over this whole period is parsed in my previous post).
To the right of the third vertical line, we observe a big “down wiggle” in the one month breakdown, after which it remains trendless (just like when inflation was stable before the pandemic hit). The 12 month breakdown shows inflation falling and then becoming also “trendless” (or stable"). This same pattern is true for the officially targeted PCE inflation.
What is worrying the Fed (and market participants and pundits that worry about what the Fed worries) is that after falling significantly between mid 2022 and mid 2023, CPI inflation has stabilized at a level that is above the 2% target! This is what is giving Powell and the Fomc “nightmares”, and pushing them to decry “rates higher for longer” (in this week´s meeting the dot plot shows that members reduced the number of expected rate cuts this year from 3 to1!).
Either market participants have more faith in the Fed than the Fed itself does, or market-based measures of inflation expectations are not useful. Since mid 2002 through now (mid 2024) inflation expectations have (at the 5-yr, 5-yr 5-yr forward and 10-yr) remained very stable at a rate consistent with PCE running at 2%.
One explanation is that the market “sees” inflation running at 2% over time, and that´s the reason for CPI inflation remaining stable at a level above 2%. The markets anticipate that it will drop to the 2% rate, and they believe this because, once the “villain” is “stripped-out” of the CPI, the CPI less shelter is floating around 2%!
The next image shows the “relation” between the CPI and the CPI less shelter, taking into account the behavior of the “villain” (OER). This “relation” is always true but for clarity I just show the post Covid-19 period. (The reason for the “relation” is that OER is subtracted from the CPI to give you CPI less shelter)
The “relation” is that when OER runs below COI, CPI less shelter is above CPI. When OER runs above CPI, CPI less shelter runs below CPI. When OER runs at the same rate as CPI, CPI less shelter runs at the same rate.
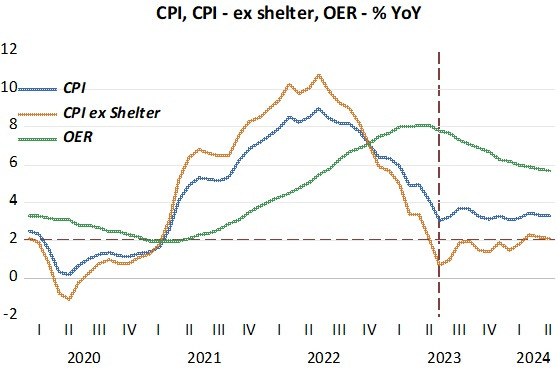
Once OER inflation peaked and began to drop, both the CPI and CPI less shelter stopped falling and stabilized. With OER coming down further, the difference between the CPI and CPI less shelter will decrease. The CPI will decrease and the CPI less shelter may rise. They could meet somewhere in between their present rates (say 2.5%), which is consistent with PCE running at 2%!
The Fed is the “engine” of inflation, but if it “reads” it the wrong way, the fed could become the “engine” of recession.
Reading the tea leaves seems easy for you as compared to Powell.
Powell
#1 “there was a time when monetary policy aggregates were important determinants of inflation and that has not been the case for a long time”
#2 “Inflation is not a problem for this time as near as I can figure. Right now, M2 [money supply] does not really have important implications. It is something we have to unlearn.”
#3 “the correlation between different aggregates [like] M2 and inflation is just very, very low”.
The concern is not the relationship between the CPI or PCE. It may be said that there is no single figure compiled which represents the value of money. Rather the concern is the relationship of money to the level and movement of prices.
It is a well-known fact that a rise in prices, if not too rapid and extreme, has a stimulating effect on business profit expectations. Acting under the impulse that wider profit margins are in the offing, businesses will go into debt, hire workers, buy additional inventory, expand their rate of operations, and if their optimistic anticipations cover a long enough period, decide to expand their plant capacity, and develop new outlets for their products.