
Peering through the fog in search of light
Peering through the fog in search of light
and dimming the noise

The economy is shrowded in fog in a noisy environment, making it doubly difficult to glimpse what is really happening under our feet!
For example, for almost two years, a recession has been imminent. More recently, concerning inflation, the worry is that it has stopped falling and that it might be picking up.
Real growth, however, has been chugging along in the 2%-4% range for some time. More importantly, it has regained the level path that prevailed before C-19. (which had been regained in late 2021 and again lost due to the Russian invasion). Regarding inflation, it may have stopped falling simply because it has reached the 2% target! In addition, unemployment is at its lowest level since the late 1960s.
Let´s start with the inflation “disfunction”. This piece in Alphaville “A contrarian take on the US inflation freakout” provides background detail.
Basically, what has been “injuring” inflation is Owners Equivalent Rend" (OER). As the article´s writer puts it:
Calculations of OER are dubious (it is imputed based on rents for comparable rental housing). The EU HICP and UK’s CPI measures — which the ECB and BoE target, respectively — exclude it. As Andrew Hunter, US economist at Capital Economics put it: Much of the debate on inflation across developed markets right now is being driven by comparing apples to oranges.
A visual comparison proves useful. The chart compares the Core CPI to the Core Harmonized CPI since the introduction of the latter in the late 1990s. (Note that one third of the Core CPI is OER, a big chunk!).
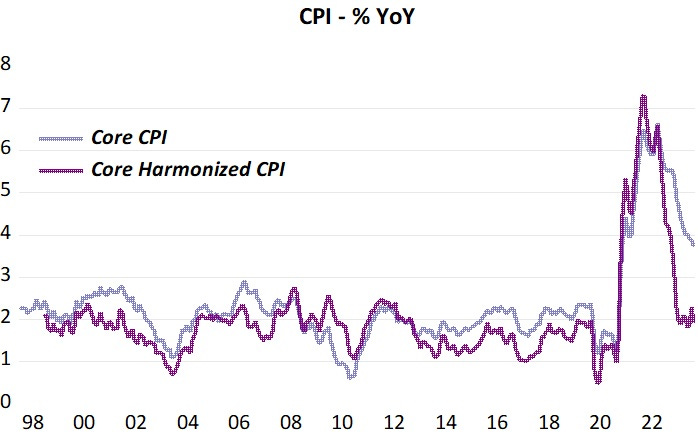
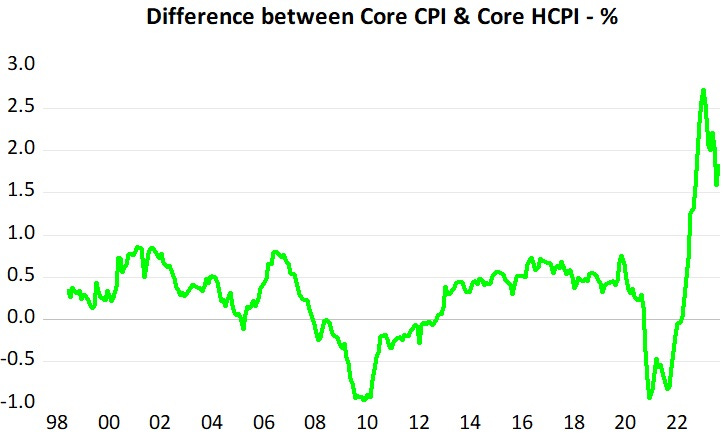
While Core CPI remains elevated, the Harmonized version is back on the 2% target. The next chart shows a recent “anomaly”, with the difference between Core & Harmonized CPI, being unusually large. Most likely this is due to bad “guestimates” of OER coming out of the pandemic (hopefully they will improve going forward, bringing the two indices back into “balance”).
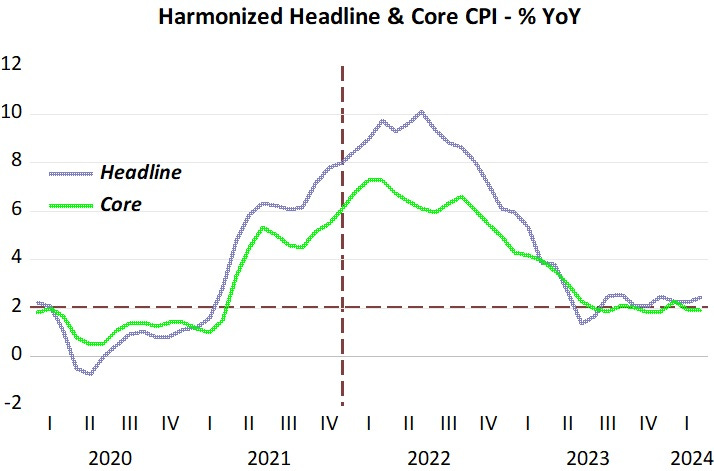
The next chart provides the more recent (post pandemic) behavior of both the Harmonized Headline & and Core CPI. Both are on or very near the 2% target. (the vertical line will be explained later).
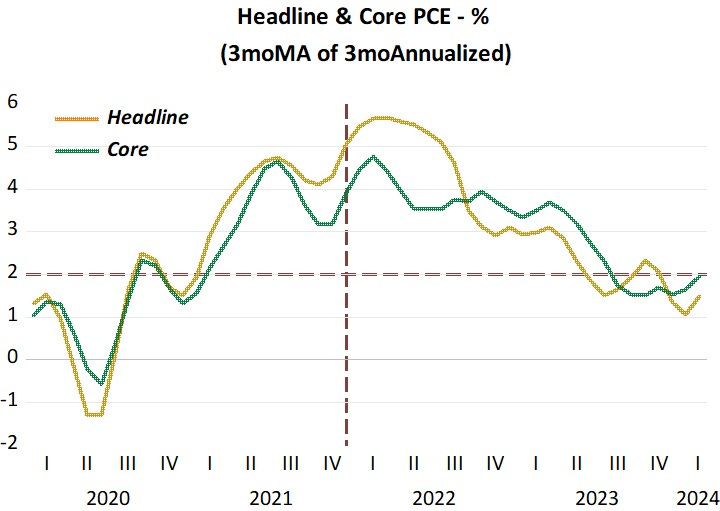
The next chart shows a smoother version of the PCE. This is done to “dim the noise”. Note that the weight of OER in the Core PCE is much lower than in the Core CPI (13% vs 34%). Again the vertical line will be explained later. Both the smoother versions satisfy the 2% target.
By focusing on a poor guestimate, the Fed risks derailing the economy!
The nominal economy leads, and the nominal economy is well captured by the behavior of Aggregate Nominal Spending (or NGDP). Below the behavior of the smoothed NGDP for the last 3 decades.
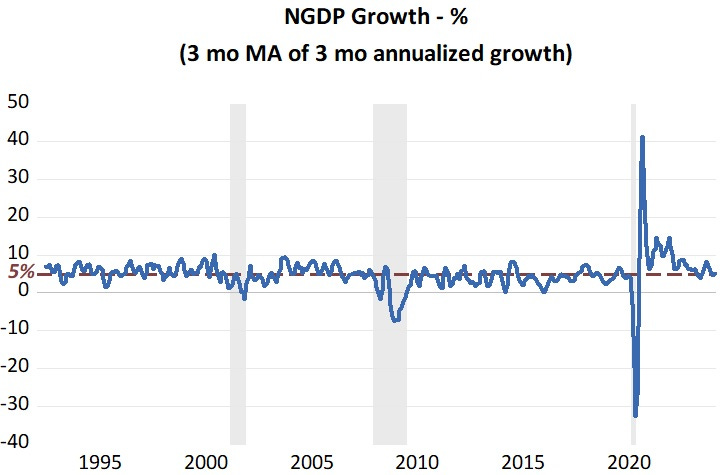
5% represents the long term average that prevailed before C-19 hit. We note that smoothed (to dim the noise) version of spending growth is back close to 5%. A “zoom-in” on the chart below.
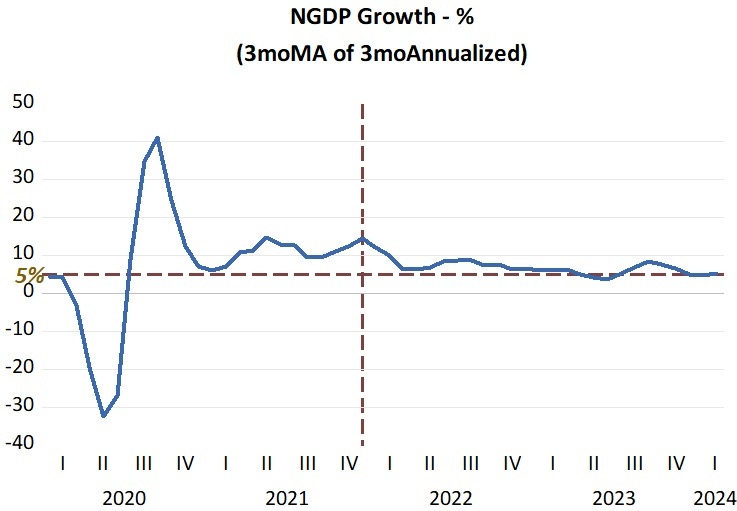
Now I can explain the vertical line. In the NGDP growth chart the vertical line marks the moment when NGDP growth began to converge to the 5% long-term average. Looking at the inflation charts above, we note that soon after inflation peaked and began to fall. In the case of Headline numbers the delay is due to the shock associated with the Russian invasion in early 2022. But they “catch-up” to the core numbers.
My inference is that the Fed should play down badly conceived inflation numbers and put effort in keeping NGDP evolving close to the 5% rate. If so, the outcome will most likely be a “wonderful economy”, with low (on target) inflation, adequate real gowth and low and stable unemployment. “Biden says thank you very much, Powell”!
The FED can start tightening after 2-3 consecutive quarters of > 5% N-gDp.
N-gDp
2020-01-01 -3.5
2020-04-01 -29.2
2020-07-01 39.7
2020-10-01 7.1
2021-01-01 10.9 begin tightening
2021-04-01 12.8
2021-07-01 9.5
2021-10-01 14.6
2022-01-01 6.2
2022-04-01 8.5
2022-07-01 7.2
2022-10-01 6.5
2023-01-01 6.3
2023-04-01 3.8
2023-07-01 8.3
2023-10-01 5.1
"Inflation is the one form of taxation that can be imposed without legislation." - Milton Friedman
Economists are generally vacuous. Economists don't know:
the difference between the supply of money & the supply of loan funds,
the difference between means-of-payment money & liquid assets,
the difference between financial intermediaries & money creating institutions,
doesn't know that interest rates are the price of loan-funds, not the price of money,
that the price of money is represented by the various price (indices) level,
that inflation is the most important factor determining interest rates, operating as it does through both the demand for & the supply of loan-funds.
The GOSPEL needs no DISCLAIMER