A monetary story of the post pandemic economy
Why the Fed shouldn´t switch attention between inflation & unemployment
Events and data in the last few days of July and first week of August caused havoc in markets, heightening fears of a recession.
The FOMC is divided. Members like Atlanta Fed president Bostic want to be absolutely sure about the path of inflation before supporting reductions in rates because “It would be really bad if we started cutting rates and then had to turn around and raise them again.”
Others, like Chicago Fed president Goolsbee, have become more worried about the labor market than inflation, citing recent progress in price pressures and weak jobs data.
To both New & Old Keynesians, the ‘nest’ of inflation is the labor market.
Fed Governor Laurence Meyer in a 1997 speach:
Despite the sharpness and force of the Phillips Curve/NAIRU model, it can be difficult to implement in practice. Still, this relationship was about the most stable tool in the macroeconomists' tool kit for most of the past 20 years; those who were willing to depend on it were likely to be very successful forecasters of inflation, and the record speaks for itself on this score.
More recently (June 2024), Olivier Blanchard said:
I was right in predicting inflation, but I was wrong about the channel. I thought it would happen through the labour market. It happened through commodity markets. But once you put this back in and, you know, when we analysed the ‘70s, we had it in, then there is nothing terribly surprising.
Long ago ( June 2000), however, William Poole, a well known monetarist, said in the FOMC Meeting:
The traditional NAIRU formulation views the wage/price process as running off a gap–a gap measured somehow as the GDP gap or the labor market gap. And the direction of causation goes pretty much from something that happens to change the gap that feeds through to alter the course of wage and price changes.
I think there is an alternative model that views this process from an angle that is 180 degrees around. It says that in an earlier conception, either through a determination of a monetary aggregate or through a federal funds rate policy, monetary policy pins down the price level or the rate of inflation and, therefore, expectations of the rate of inflation.
Then the labor market settles, as it must, at some equilibrium rate of unemployment. Where the labor market settles is what Milton Friedman called the natural rate of unemployment. But the causation goes fundamentally from monetary policy to price determination and then back to the labor market rather than from the labor market forward into the price determination. I certainly view the causation in that second sense.
My only disagreement with Poole, who is not a believer in the “gap theories of inflation”, is that the stance of monetary policy is not best characterized by either the determination of a monetary aggregate or through a federal funds rate policy, but through the movements in NGDP growth. And to obtain the “natural” rate of unemployment, NGDP growth should remain stable at a sustainable rate.
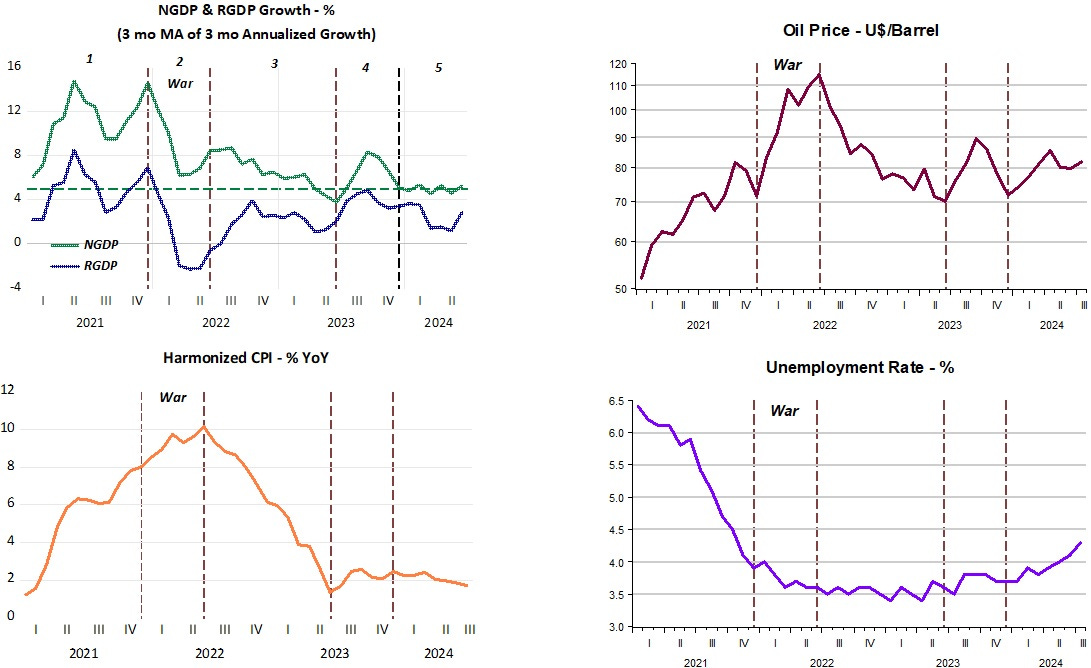
The charts below cover the period since early 2021, one year into the pandemic, when inflation first ‘blossomed’. NGDP growth, which best reflects the stance of monetary policy, is the “guiding light” to understand how the inflation process evolved.
The period is devided into five areas, defined by if monetary policy (NGDP growth) was strongly or weakly expansionary, strongly or weakly tightening, or stable. It also helps us identify when demand or supply shocks predominated.
Inflation is represented by the Harmonized CPI, a cleaner index, that excludes owner´s equivalent rent which, according to Kevin Erdmann, makes better sense in the analysis of cyclical monetary policy.
Supply shocks are represented by oil prices (there are also effects from supply chain disruptions, but impacts from lockdowns had mostly dissapeared).
The charts:
What triggered the excessive monetary growth, leading to a rising and strong NGDP growth in early 2021? That was not happenstance or fortuitous. “Coincidentally”, on February 10, 2021, Powell gave a speech at the Economic Club of New York. The title was: “Getting back to a strong labor market”. The conclusion reads:
Seventy-five years ago, in the wake of WWII, the United States faced the challenge of reemploying millions amid a major restructuring of the economy toward peacetime ends. Part of Congress's response was the Employment Act of 1946, which states that "it is the continuing policy and responsibility of the federal government to use all practicable means . . . to promote maximum employment." As later amended in the Humphrey-Hawkins Act, this provision formed the basis of the employment side of the Fed's dual mandate. My colleagues and I are strongly committed to doing all we can to promote this employment goal.
Observe that unemployment took a dive. At that point inflation, which was still below the 2% target, climbed quickly. I can conclude that during stage 1, the demand shock prevailed because real growth also increased! The negative supply shock from rising oil prices mostly enhanced the impact of the demand shock on inflation.
Towards the end of 2021 (region 2), the Fed´s worries quickly turned to inflation, with policy tightening (NGDP growth falling).
Preparations for war followed by the invasion of Ukraine boosted oil prices (and supply chains tightened). The increase in inflation and fall in real growth is the hallmark of a negative supply shock predominating. The concomitant tightening of monetary policy (falling NGDP growth) enhaced the drop in real growth. Remember that negative real growth during the first half of 2022 brought recession fears to the fore! Recession fears, however, were quicly dismissed because unemployment continued to fall.
In region 3 we observe a gradual tightening of monetary policy (gradual fall in NGDP growth) and a significant drop in oil price. With inflation falling and real growth rising, I conclude that during this period a positive supply shock predominated, with the gradual tightening of monetary policy “constraining” the increase in real growth and enhancing the fall in inflation.
Unemployment remained (very) low and stable. But because the Funds rate was rising recession worries again increased. By the end of 2022, especially because the yield curve had turned negative, the perceived probability of recession in 2023 rose significantly.
Region 4 covers the second half of 2023. There is a brief spike in both NGDP growth and oil prices. Inflation moves up a little but stays close to 2%. Real growth remains robust in the 3.5%-5% range. In short, nothing of note happened. And the “awaited” recession did not materialize!
Region 5 focuses on 2024. NGDP growth remains stable (monetary policy is neither expansionary or contractionary). Inflation remains stable at 2% before falling a bit at the end of the period to 1.7%. The brief drop in real growth may be due to the uplift in oil prices. With NGDP growth remaining stable, real growth went back to 3%.
The “outlier” is unemployment, which increased a little in region 4 (second half of 2023) but has risen more significantly so far in 2024.
Low inflation at present and an increase in unemployment may be triggering a change in sentiment (as reflected in the Goolsbee quote above).
This FOMC flip-flop between unemployment-inflation-unemployment… is only good to generate speeches by FOMC members, weekly (daily) letters from Bank´s economic departments and press interviews that search for “scandulous” views!
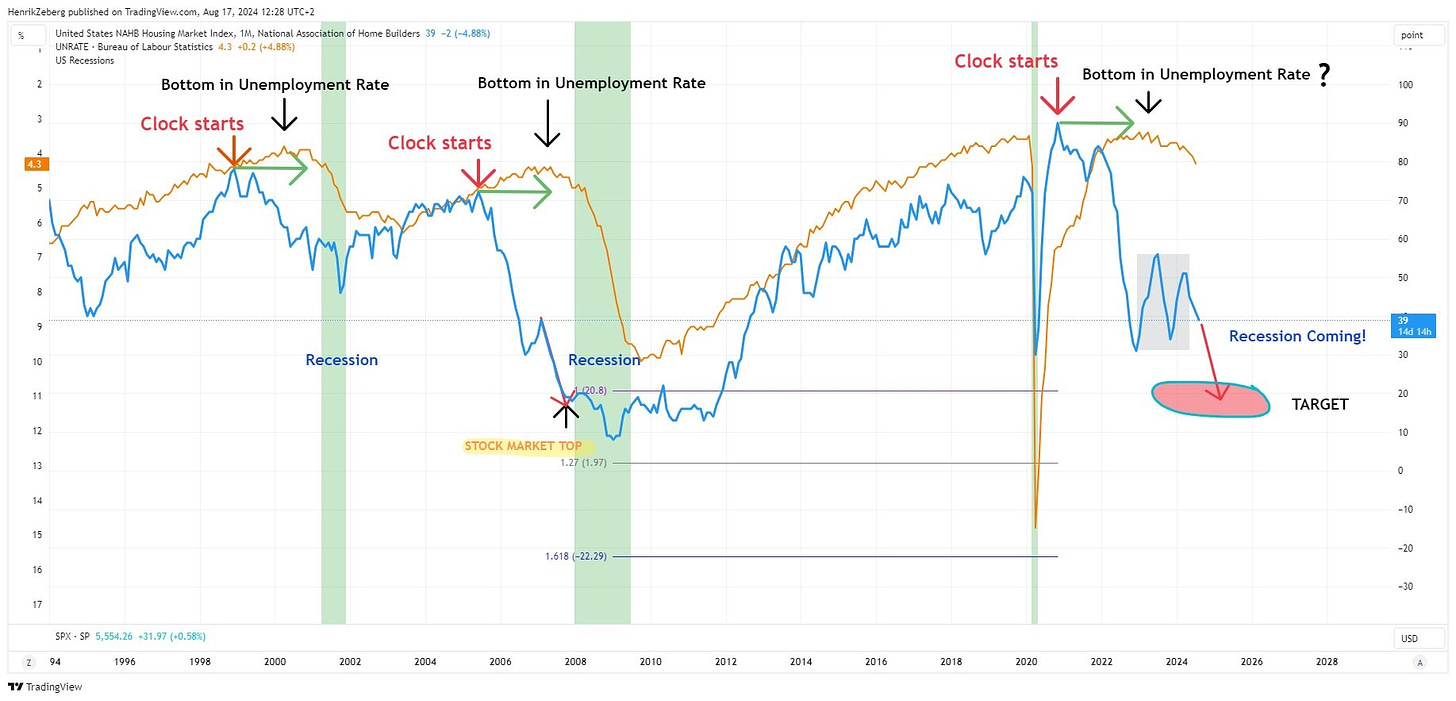
This tweet (August 17)is fun:
Recession IS coming! NAHB (National Association of Home Builders) Housing Index leads the Economy.
As yields and rates spike up - Housing Market gets hit. This is the BLUE LINE Slowly this decline in Housing Index spills over into the Labour Market as consumers hold back on spending. It is not immediate - but slowly. We have seen it all before - and the bigger the decline in NAHB - the larger the rise in Unemployment. This is the ORANGE LINE. And it is turning down (Unemployment is moving UP!) We are heading right into a Recession with the largest speculative Bubble EVER. Worst Recession and Bear Market since 1929!
But in April 2022 he was saying the same thing on a Youtube interview!
Maybe these outlandish views derive from Edward Leamer´s (UCLA) 2007 paper Housing IS the business cycle”.
Of the components of GDP, residential investment offers by far the best early warning sign of an oncoming recession. Since World War II we have had eight recessions preceded by substantial problems in housing and consumer durables.
In comments to Leamer´s paper, Frank Smets, now an adviser at the European Central Bank (ECB) and a staunch proponent of applying New Keynesian DSGE models for policy purposes, wrote:
Professor Leamer´s claim is “Housing IS the business cycle”. I will basically make three comments.
First, in view of the high interest rate sensitivity of residential investment compared to other GDP components, a crucial factor for undertanding the relationship between the housing cycle and the business cycle are interest rates.
It would, therefore, be useful to assess whether the leading indicator properties of housing starts continue to hold once interest and, in particlar, the term spread are taken into account.
If most of the leading indicator properties of housing comes from the interest rate cycles then we need to think about about monetary policy and not the housing market as a source of business cycle movements…
…Third, Professor Leamer argues in favor of a housing target for the Fed. I will argue that the evidence in his paper suggests there is no significant trade-off between stable and low inflation and a stable housing market. If anything, the two are complementary.
My main point of disagreement with professor Smets is his close association of interest rates and monetary policy. In that case, I think it would be hard to distinguish between monetary policy and the housing market as a source of business cycle movement.
I quite agree with the view that there is no significant trade-off between stable and low inflation and a stable housing market. That would be true if monetary policy, the stance of which is better defined by NGDP growth, strived to attain Nominal Stability (a stable rate of NGDP growth). In that case, a stable and low inflation and a stable housing market would certainly be complementary.
My tentative conclusion is that it is the housing market that is being impacted by the “wrong” high level of rates. If that´s true, keeping NGDP growth stable (nominal stability) will allow the Fed to reduce interest rates significantly, being rewarded with a strong improvement in the housing market!
What about the recent “frightening” increase in the unemployment rate (that has breached the now popular Sahm rule)?
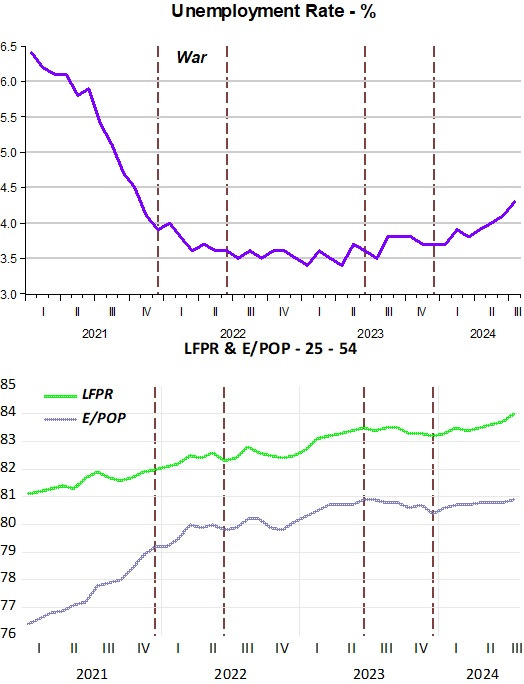
I´ll make my arguments based on the two charts below, remembering that the rate of unemployment is determined by two variables, the employment population ratio (E/POP) and the labor force participation rate (LFPR) and calculated as 1-(E/POP/LFPR).
During the very short but very deep recession between April and May 2020, the E/POP ratio fell more than 10 pp from the peak it had first reached at the end of the 1990s, the heyday of the Great Moderation. LFPR fell a little over 3pp from the pre C-19 recession peak (which was just over 1pp below the late 1990s peak).
After rising smartly between May and December 2020, both the E/POP ratio and the LFPR continued to rise during 2021, especially the E/POP ratio. This tells me that monetary policy, reflected in the strong rise in NGDP growth, removed the “pessimistic veil” that covered the economy when the pandemic hit.
The observed behavior of both the E/POP and the LFPR are a sign of the “attractiveness’ of the lbor market, supported by favorable views of the economic future.
During 2021 and 2022, with the ratio between these two variables rising, unemployment had nowhere to go but down. During 2023, the ratio between the E/POP and the LFPR stabilized and so did the unemployment rate.
During 2023, maybe reflecting less optimistic views about the future (lots of recession talk, for example), these ratios didn´t move much, but the E/POP ratio lost some relative ground, lifting unemployment a bit.
This year, while the E/POP ratio went again back to the peak levels of the late 1990s, the LFPR which had lagged a little, climbed back to its historical (post WWII) peak in the late 1990s. During this transition, reflecting a positive view (not, as some argue, weakening) of the labor market, the rate of unemployment rose (but is still very similar to the unemployment rate observed during the late 1990s.
What can we expect going forward? As usual, it depends on the Fed. If it manages to retain Nominal Stability, and reduce interest rates, which will help improve the housing market, employment would rise together with participation, sustaining a low and stable rate of unemployment (together with low and stable inflation and a stable rate of real growth).
Negative geo-political (and even domestic political) induced supply shocks could turn the ride a bit bumpy, but less so if the Fed keeps its focus on maintaining Nominal Stability.


Fantastic post!
Contrary to the oil price rise due to the war in Ukraine, the "administered" prices would not be the "asked" prices, were they not “validated” by (M*Vt), i.e., “validated” by the world's Central Banks. Oil prices paralleled money flows, the volume and velocity of money. It can be no other way.